Murton, County Durham facts for kids
Quick facts for kids Murton |
|
|---|---|
Woods Terrace, Murton, in around 1907 |
|
| Population | 4,534 (2011 Census) |
| OS grid reference | NZ323702 |
| Unitary authority | |
| Ceremonial county | |
| Region | |
| Country | England |
| Sovereign state | United Kingdom |
| Post town | SEAHAM |
| Postcode district | SR7 |
| Dialling code | 0191 |
| Police | Durham |
| Fire | County Durham and Darlington |
| Ambulance | North East |
| EU Parliament | North East England |
| UK Parliament |
|
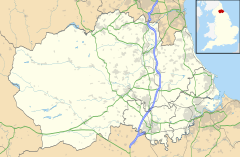
Murton is a village located in County Durham, England. It is about 8 miles (13 km) east of the city of Durham. The village is also about 6 miles (10 km) south of Sunderland. In 2011, Murton had a population of 7,676 people.
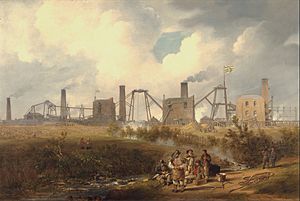
Murton was once a small farming village. It was known as Morton. But in the 1800s, coal was found underground. This changed the village into a busy industrial town. It became known as Murton Colliery. This was because a coal mine, or 'pit', was dug in 1838. The mine was very important for over 100 years. At its busiest, more than 1,000 men worked there.
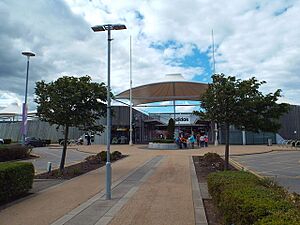
The village also had other jobs. There was a bakery and a bus garage. In 1955, a factory was built to make products from coal, like coke. The mine and other jobs closed in the 1990s. This happened to many mines in County Durham. Now, the old mining waste areas are covered by a shopping center called Dalton Park. This has brought new jobs to Murton.
Contents
Murton's Mining History
The discovery of coal in the 1800s changed Murton. It grew from a tiny farming area into a busy mining town.
After the mine closed, the community faced challenges. But now, money is being invested in Murton. This is helping to change the village.
Before 1830, fewer than 100 people lived in Murton. After the mine opened in 1838, the population grew fast. By 1851, there were 1,387 people. Miners came to Murton from all over. Many came from County Durham and Northumberland. Later, people also moved from Devon, Cornwall, and Ireland. Some street names in Murton show where these miners came from.
Work on the Murton Colliery started in 1838. But it took five years to get the first coal. This was because of problems with sand and deep rock. It made the project very expensive. Workers even started working late shifts. This helped to finish the mine faster.
In 1848, there was an explosion at the mine. Sixteen miners died. This was a sad event for the village. But Murton continued to grow. By 1856, it looked very different. Many houses were built for the miners. The village had three pubs and a new school. It also had gas and coke factories. More miners came, and so did more shopkeepers. The Murton Colliery Co-operative Society opened by 1890.
The mine also grew and became more modern. After World War I, new machines were added. In 1939, new baths for the miners were built. Murton also opened a swimming pool in 1961.
But in 1991, the mine was closed. People tried to keep it open, but they could not. The mine's tall winding tower was taken down in 1994. Murton's busy mining days were over.
Key Moments in Murton's History
- 1830: Population was 69 people.
- 1838: Work on the coal mine began.
- 1843: First coals were brought out of the mine.
- 1851: Population grew to 1,395 people.
- 1889: Electricity was first used in the mine.
- 1902: Three young workers (putters) died in the mine.
- 1906: The mine produced 4,131 tons of coal in one day.
- 1910: Miners went on strike over working hours.
- 1913: First council house foundation stone was laid.
- 1914: First public telephone for Murton was set up.
- 1922: A war memorial (Cenotaph) was unveiled.
- 1923: Coal was drawn from the West Pit for the first time.
- 1927: Bus service to Sunderland started.
- 1930: First talking movies shown at Murton Empire cinema.
- 1931: Modern toilets installed in mine workers' houses.
- 1935: Miners started using electric lamps.
- 1939: Pit-head baths for miners opened.
- 1950: An X-ray van visited Murton for health checks.
- 1953: Workers got their first two-week paid holiday.
- 1957: A new library opened.
- 1958: Murton Brickworks closed.
- 1961: Murton's swimming pool opened.
- 1982: First memorial service for miners who died at Murton pit.
- 1990: Miners fought to keep the pit open.
- 1991: Murton Colliery closed.
- 1994: The pit winding tower was taken down.
- 2003: Dalton Park shopping center opened.
- 2023: Murton was a filming location for the movie The Old Oak. This film is about a former mining community.
How Murton is Governed
Murton is part of an electoral ward. This is a local area for voting. The ward includes Murton and nearby areas like Dalton-le-Dale. In 2011, this ward had a total population of 7,975 people.
Murton's Economy
The economy of Murton has changed over time. In the past, mining was the main source of jobs. After the mine closed, new businesses came to the area. For example, the Dalton Park shopping center provides many jobs today. This helps the local economy grow.
Murton's Climate
| Weather chart for Murton | |||||||||||||||||||||||||||||||||||||||||||||||
|---|---|---|---|---|---|---|---|---|---|---|---|---|---|---|---|---|---|---|---|---|---|---|---|---|---|---|---|---|---|---|---|---|---|---|---|---|---|---|---|---|---|---|---|---|---|---|---|
| J | F | M | A | M | J | J | A | S | O | N | D | ||||||||||||||||||||||||||||||||||||
|
56
6
1
|
39
7
1
|
51
9
2
|
52
11
3
|
50
15
6
|
55
17
9
|
45
20
11
|
61
20
11
|
58
17
9
|
57
13
6
|
62
9
3
|
59
7
2
|
||||||||||||||||||||||||||||||||||||
| temperatures in °C precipitation totals in mm |
|||||||||||||||||||||||||||||||||||||||||||||||
|
Imperial conversion
|
|||||||||||||||||||||||||||||||||||||||||||||||
Murton has a temperate climate. This means it has mild temperatures. It does not get too hot or too cold. The average yearly rainfall is about 643.3 mm (25.3 inches). This is less than the average for the whole United Kingdom.
Murton also has fewer rainy days. On average, there are about 121 days with more than 1 mm (0.04 inches) of rain. The area gets about 1374.6 hours of sunshine each year. This is more than the national average. There are about 52 days with frost.
The average daily temperatures in Murton are around 12.5°C (54.5°F) for the maximum. The average minimum temperature is about 5.2°C (41.4°F).
The table below shows average temperature and rainfall figures. These were taken between 1971 and 2000. The data comes from the Met Office weather station in Durham.
| Climate data for Durham 102m asl, 1981–2010, extremes 1850– | |||||||||||||
|---|---|---|---|---|---|---|---|---|---|---|---|---|---|
| Month | Jan | Feb | Mar | Apr | May | Jun | Jul | Aug | Sep | Oct | Nov | Dec | Year |
| Record high °C (°F) | 16.7 (62.1) |
17.4 (63.3) |
21.7 (71.1) |
24.1 (75.4) |
27.8 (82.0) |
30.6 (87.1) |
31.0 (87.8) |
32.5 (90.5) |
30.0 (86.0) |
25.0 (77.0) |
19.4 (66.9) |
15.9 (60.6) |
32.5 (90.5) |
| Mean daily maximum °C (°F) | 6.6 (43.9) |
7.2 (45.0) |
9.5 (49.1) |
11.9 (53.4) |
15.0 (59.0) |
17.6 (63.7) |
20.1 (68.2) |
19.8 (67.6) |
17.2 (63.0) |
13.3 (55.9) |
9.4 (48.9) |
6.7 (44.1) |
12.9 (55.2) |
| Mean daily minimum °C (°F) | 0.9 (33.6) |
0.9 (33.6) |
2.3 (36.1) |
3.7 (38.7) |
6.1 (43.0) |
9.0 (48.2) |
11.1 (52.0) |
11.0 (51.8) |
9.0 (48.2) |
6.3 (43.3) |
3.4 (38.1) |
1.1 (34.0) |
5.4 (41.7) |
| Record low °C (°F) | −17.2 (1.0) |
−18.3 (−0.9) |
−15 (5) |
−11.1 (12.0) |
−4.4 (24.1) |
−1.1 (30.0) |
1.1 (34.0) |
0.6 (33.1) |
−1.1 (30.0) |
−5.5 (22.1) |
−8.8 (16.2) |
−16.6 (2.1) |
−18.3 (−0.9) |
| Average rainfall mm (inches) | 52.3 (2.06) |
41.8 (1.65) |
44.6 (1.76) |
52.7 (2.07) |
44.2 (1.74) |
55.4 (2.18) |
54.0 (2.13) |
60.8 (2.39) |
55.4 (2.18) |
60.9 (2.40) |
72.0 (2.83) |
57.0 (2.24) |
651.1 (25.63) |
| Mean monthly sunshine hours | 58.6 | 80.3 | 115.5 | 150.3 | 181.7 | 164.8 | 172.3 | 167.3 | 134.5 | 102.8 | 66.4 | 51.2 | 1,445.4 |
| Source 1: Met Office | |||||||||||||
| Source 2: NEForum | |||||||||||||
Notable People from Murton
- Mary Ann Cotton (1832–1873) was a person who grew up in Murton. She became known for a serious crime.
 | George Robert Carruthers |
 | Patricia Bath |
 | Jan Ernst Matzeliger |
 | Alexander Miles |


