Portola, California facts for kids
Quick facts for kids
City of Portola
|
|
|---|---|

Union Pacific trains in Portola
|
|

Location in Plumas County and the state of California
|
|
| Country | |
| State | |
| County | Plumas |
| Incorporated | May 16, 1946 |
| Area | |
| • Total | 5.41 sq mi (14.00 km2) |
| • Land | 5.41 sq mi (14.00 km2) |
| • Water | 0.00 sq mi (0.00 km2) 0% |
| Elevation | 4,856 ft (1,480 m) |
| Population
(2020)
|
|
| • Total | 2,100 |
| • Density | 388/sq mi (150/km2) |
| Time zone | UTC-8 (Pacific (PST)) |
| • Summer (DST) | UTC-7 (PDT) |
| ZIP codes |
96122, 96129
|
| Area code | 530 |
| FIPS code | 06-58352 |
| GNIS feature IDs | 1659425, 2411473 |
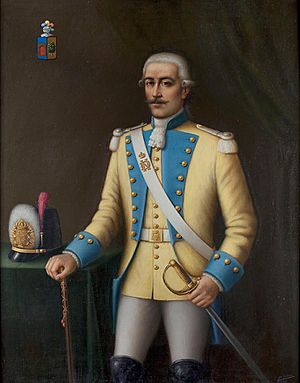
Portola (/pɔːrˈtoʊlə/ por-TOH-lə) is a small city in Plumas County, California. It is the only official city in the county. In 2020, about 2,100 people lived there. Portola is located on the Middle Fork of the Feather River. The city was named after a Spanish explorer, Gaspar de Portolá. However, he never actually explored this specific area.
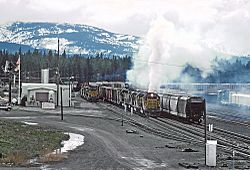
Portola is an important spot for trains on the Western Pacific Railroad (now Union Pacific Railroad). This route goes over the Sierra Nevada mountains. The city is also home to the Western Pacific Railroad Museum. This museum is one of the biggest train museums in the western United States. It's famous for its "Run A Locomotive" program. This program lets people experience driving a real train on the museum grounds. The city also celebrates its train history with a yearly event called "Railroad Days."
In the late 1990s, Portola was in the news because of a problem in Lake Davis. An unwanted fish called northern pike was found in the lake. The California Department of Fish and Wildlife worked to remove these fish. In 1997, the lake was treated with chemicals to get rid of them. But the fish came back in 1999. In 2007, the department used a new liquid treatment to remove the pike again.
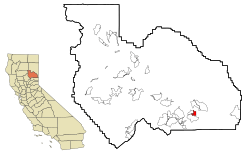
The city of Portola sits along both sides of the Middle Fork of the Feather River. It is in the eastern part of Northern California's Plumas County. Portola is on the eastern slopes of the Sierra Nevada mountains. The area is part of the Feather River drainage system. This system flows westward down the Feather River Canyon.
Contents
Geography and Local Environment

Portola is located at 39°48′37″N 120°28′11″W / 39.810151°N 120.469843°W. The city covers about 5.4 square miles (14 km2) of land. There is no water area within the city limits.
Portola is on the Middle Fork of the Feather River. This river is part of the Sierra Nevada mountain range. The river starts just east of Portola in Sierra Valley, near Beckwourth.
Lake Davis is about 6 miles (9.7 km) north of Portola. It is a popular place for fishing and camping. About 15 miles (24 km) west of Portola, you can find Plumas-Eureka State Park. This park and the Lakes Basin Recreation Area have granite peaks and clear lakes. They also have streams and forests with tall trees. These areas are great for people who love outdoor activities.
Portola's Climate
Portola is on the eastern side of the Sierra Nevada mountains. It has a special type of climate called a continental Mediterranean climate. This means it has dry summers with big temperature changes between day and night. Winters are cold and snowy, but usually not extremely harsh.
It often freezes in Portola, about 218 mornings each year. Very cold temperatures below 0 °F (−17.8 °C) are rare. They happen only about 2 or 3 mornings in an average winter. In the summer, temperatures of 100 °F (37.8 °C) are also rare. They happen only about once every two years.
| Climate data for Portola, California (1991–2020 normals, extremes 1915–present) | |||||||||||||
|---|---|---|---|---|---|---|---|---|---|---|---|---|---|
| Month | Jan | Feb | Mar | Apr | May | Jun | Jul | Aug | Sep | Oct | Nov | Dec | Year |
| Record high °F (°C) | 68 (20) |
72 (22) |
80 (27) |
86 (30) |
94 (34) |
110 (43) |
110 (43) |
107 (42) |
100 (38) |
92 (33) |
82 (28) |
72 (22) |
110 (43) |
| Mean maximum °F (°C) | 56 (13) |
59 (15) |
66 (19) |
74 (23) |
83 (28) |
91 (33) |
96 (36) |
94 (34) |
91 (33) |
82 (28) |
76 (24) |
56 (13) |
98 (37) |
| Mean daily maximum °F (°C) | 43.0 (6.1) |
45.0 (7.2) |
50.9 (10.5) |
57.7 (14.3) |
67.0 (19.4) |
77.2 (25.1) |
85.4 (29.7) |
84.7 (29.3) |
77.8 (25.4) |
66.4 (19.1) |
51.9 (11.1) |
41.7 (5.4) |
62.4 (16.9) |
| Daily mean °F (°C) | 30.9 (−0.6) |
33.2 (0.7) |
38.1 (3.4) |
43.4 (6.3) |
51.0 (10.6) |
58.7 (14.8) |
65.0 (18.3) |
63.6 (17.6) |
57.4 (14.1) |
48.1 (8.9) |
38.0 (3.3) |
30.4 (−0.9) |
46.5 (8.0) |
| Mean daily minimum °F (°C) | 18.9 (−7.3) |
21.4 (−5.9) |
25.3 (−3.7) |
29.1 (−1.6) |
35.1 (1.7) |
40.1 (4.5) |
44.6 (7.0) |
42.6 (5.9) |
36.9 (2.7) |
29.7 (−1.3) |
24.1 (−4.4) |
19.2 (−7.1) |
30.6 (−0.8) |
| Mean minimum °F (°C) | 2 (−17) |
5 (−15) |
11 (−12) |
19 (−7) |
26 (−3) |
30 (−1) |
36 (2) |
34 (1) |
29 (−2) |
20 (−7) |
11 (−12) |
2 (−17) |
−3 (−19) |
| Record low °F (°C) | −24 (−31) |
−21 (−29) |
−12 (−24) |
3 (−16) |
13 (−11) |
20 (−7) |
22 (−6) |
19 (−7) |
12 (−11) |
3 (−16) |
−6 (−21) |
−28 (−33) |
−28 (−33) |
| Average precipitation inches (mm) | 4.16 (106) |
3.93 (100) |
3.57 (91) |
1.55 (39) |
1.15 (29) |
0.52 (13) |
0.34 (8.6) |
0.30 (7.6) |
0.44 (11) |
1.07 (27) |
2.03 (52) |
4.28 (109) |
23.34 (593) |
| Average snowfall inches (cm) | 18.7 (47) |
17.6 (45) |
14.0 (36) |
4.8 (12) |
0.6 (1.5) |
0.0 (0.0) |
0.0 (0.0) |
0.0 (0.0) |
0.1 (0.25) |
0.4 (1.0) |
5.8 (15) |
15.2 (39) |
77.2 (196.75) |
| Average precipitation days (≥ 0.01 in) | 8.7 | 8.5 | 8.1 | 6.0 | 5.7 | 2.6 | 1.0 | 1.2 | 1.8 | 3.5 | 6.2 | 8.4 | 61.7 |
| Average snowy days (≥ 0.1 in) | 3.6 | 3.0 | 2.5 | 1 | 0.0 | 0.0 | 0.0 | 0.0 | 0.0 | 0.5 | 1.5 | 3.1 | 15.2 |
| Source: NOAA | |||||||||||||
Population of Portola
| Historical population | |||
|---|---|---|---|
| Census | Pop. | %± | |
| 1950 | 2,261 | — | |
| 1960 | 1,874 | −17.1% | |
| 1970 | 1,625 | −13.3% | |
| 1980 | 1,885 | 16.0% | |
| 1990 | 2,193 | 16.3% | |
| 2000 | 2,227 | 1.6% | |
| 2010 | 2,104 | −5.5% | |
| 2019 (est.) | 1,930 | −8.3% | |
| U.S. Decennial Census | |||
Population in 2010
The 2010 United States Census counted 2,104 people living in Portola. This means there were about 389.1 inhabitants per square mile (150.2/km2) people per square mile. Most of the people (83.7%) were White. About 2.6% were Native American, and 0.6% were Asian. People of Hispanic or Latino background made up 16.3% of the population.
Almost everyone (98.9%) lived in homes. Only a small number (1.1%) lived in places like care facilities. There were 887 households in total. About 31.3% of these households had children under 18 living there. Many households (42.6%) were married couples.
The average household had 2.34 people. The average family had 2.92 people. About 23.9% of the population was under 18 years old. People aged 45 to 64 made up the largest group, at 30.3%. The average age in Portola was 39.8 years. For every 100 females, there were about 93 males.
There were 1,134 housing units in Portola. More than half (54.3%) of these homes were owned by the people living in them. The rest (45.7%) were rented.
Population in 2000
In the year 2000, Portola had a population of 2,227 people. There were 899 households and 595 families. The population density was about 994.6 inhabitants per square mile (384.0/km2) people per square mile.
Most residents (86.21%) were White. About 2.65% were Native American, and 1.08% were Asian. People of Hispanic or Latino background made up 11.81% of the population.
About 36.7% of households had children under 18. About 48.2% were married couples. The average household size was 2.45 people. The average family size was 3.02 people.
About 29.5% of the population was under 18 years old. The median age was 37 years. For every 100 females, there were about 97 males.
See also
 In Spanish: Portola (California) para niños


