Skidmore, Missouri facts for kids
Quick facts for kids
Skidmore, Missouri
|
|
|---|---|

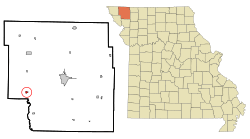
Location within Nodaway County and Missouri
|
|
| Country | United States |
| State | Missouri |
| County | Nodaway |
| Township | Monroe |
| Area | |
| • Total | 0.33 sq mi (0.85 km2) |
| • Land | 0.33 sq mi (0.85 km2) |
| • Water | 0.00 sq mi (0.00 km2) |
| Elevation | 929 ft (283 m) |
| Population
(2020)
|
|
| • Total | 245 |
| • Density | 742.42/sq mi (286.79/km2) |
| Time zone | UTC-6 (Central (CST)) |
| • Summer (DST) | UTC-5 (CDT) |
| ZIP code |
64487
|
| Area code(s) | 660 |
| FIPS code | 29-68132 |
| GNIS feature ID | 2395893 |
Skidmore is a small city located in western Nodaway County, Missouri, in the United States. In 2020, about 245 people lived there. It is a quiet farming community.
Contents
History of Skidmore
The area where Skidmore is now was first settled in 1840. A person named William Bunton moved there after the Platte Purchase made the land available.
The city of Skidmore itself was officially started in 1880. This happened when M. Skidmore gave 20 acres (about 81,000 square meters) of land. This land was given to the Nodaway Valley Railroad Company. This railroad was later taken over by the Burlington Northern Railroad. However, the railroad no longer runs through Skidmore today.
A historic building in the city, the St. Oswald's Protestant Episcopal Church, was added to the National Register of Historic Places in 1992. This means it is a special place that is protected for its history.
Geography of Skidmore
Skidmore is located on Missouri Route 113. It is about two miles north of the line between Nodaway and Holt counties. The Nodaway River flows along the west side of the city. Just north of Skidmore, Florida Creek joins the Nodaway River. The larger city of Maryville is about eleven miles to the east-northeast.
According to the United States Census Bureau, Skidmore covers a total area of 0.33 square miles (0.85 square kilometers). All of this area is land, with no water.
Population and People in Skidmore
| Historical population | |||
|---|---|---|---|
| Census | Pop. | %± | |
| 1900 | 561 | — | |
| 1910 | 562 | 0.2% | |
| 1920 | 528 | −6.0% | |
| 1930 | 538 | 1.9% | |
| 1940 | 498 | −7.4% | |
| 1950 | 485 | −2.6% | |
| 1960 | 425 | −12.4% | |
| 1970 | 440 | 3.5% | |
| 1980 | 437 | −0.7% | |
| 1990 | 404 | −7.6% | |
| 2000 | 342 | −15.3% | |
| 2010 | 284 | −17.0% | |
| 2020 | 245 | −13.7% | |
| U.S. Decennial Census | |||
How Many People Live in Skidmore? (2020 Census)
The 2020 United States census counted 245 people living in Skidmore. There were 95 households and 45 families. This means there were about 742 people per square mile. There were also 165 housing units in the city.
Most of the people in Skidmore were white (92.24%). A small number were Asian (0.41%) or from two or more races (6.94%). About 0.5% of the population was Hispanic or Latino.
In terms of households, 17.9% had children under 18 living there. About 36.8% were married couples. Many households (50.5%) had only one person living in them. Also, 24.2% of households had someone aged 65 or older living alone. The average household had 2.0 people, and the average family had 3.0 people.
The median age in Skidmore was 44.5 years old. About 14.7% of the people were under 18. About 16.7% were 65 years old or older.
Skidmore's Population in 2010
The census from 2010 showed that 284 people lived in Skidmore. There were 122 households and 81 families. The population density was about 860 people per square mile. There were 172 homes in the city.
Most people (99.3%) were White. A small number (0.4%) were Native American, and 0.4% were from two or more races.
About 29.5% of households had children under 18. Many (52.5%) were married couples living together. About 27.9% of all households had only one person. The average household size was 2.33 people.
The median age in 2010 was 45.4 years. About 21.8% of residents were under 18. About 18.7% were 65 or older. There were slightly more males (52.8%) than females (47.2%) in the city.
Education in Skidmore
The local school district for Skidmore is the Nodaway-Holt R-VII School District. This district has an elementary school located in Maitland. The junior-senior high school and the district offices are in Graham.
See also
In Spanish: Skidmore (Misuri) para niños

