Torrey Peak (Wyoming) facts for kids
Quick facts for kids Torrey Peak |
|
|---|---|

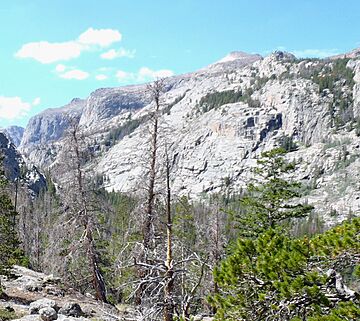
North aspect
|
|
| Highest point | |
| Elevation | 12,181 ft (3,713 m) |
| Prominence | 1,461 ft (445 m) |
| Isolation | 2.38 mi (3.83 km) |
| Parent peak | Spider Peak (12,234 ft) |
| Geography | |
| Location | Fremont County, Wyoming, U.S. |
| Parent range | Wind River Range |
| Topo map | USGS Downs Mountain |
| Climbing | |
| Easiest route | Hike |
Torrey Peak (12,181 ft (3,713 m)) is located in the northern Wind River Range in the U.S. state of Wyoming. Torrey Peak is in Shoshone National Forest near the southern end of Upper Ross Lake.
Hazards
Encountering bears is a concern in the Wind River Range. There are other concerns as well, including bugs, wildfires, adverse snow conditions and nighttime cold temperatures.
Importantly, there have been notable incidents, including accidental deaths, due to falls from steep cliffs (a misstep could be fatal in this class 4/5 terrain) and due to falling rocks, over the years, including 1993, 2007 (involving an experienced NOLS leader), 2015 and 2018. Other incidents include a seriously injured backpacker being airlifted near SquareTop Mountain in 2005, and a fatal hiker incident (from an apparent accidental fall) in 2006 that involved state search and rescue. The U.S. Forest Service does not offer updated aggregated records on the official number of fatalities in the Wind River Range.
Climate
| Climate data for Torrey Peak 43.3504 N, 109.6258 W, Elevation: 12,005 ft (3,659 m) (1991–2020 normals) | |||||||||||||
|---|---|---|---|---|---|---|---|---|---|---|---|---|---|
| Month | Jan | Feb | Mar | Apr | May | Jun | Jul | Aug | Sep | Oct | Nov | Dec | Year |
| Mean daily maximum °F (°C) | 20.3 (−6.5) |
20.0 (−6.7) |
25.8 (−3.4) |
31.2 (−0.4) |
40.1 (4.5) |
50.7 (10.4) |
60.4 (15.8) |
59.2 (15.1) |
50.3 (10.2) |
37.8 (3.2) |
25.9 (−3.4) |
19.6 (−6.9) |
36.8 (2.7) |
| Daily mean °F (°C) | 10.7 (−11.8) |
9.5 (−12.5) |
14.5 (−9.7) |
19.4 (−7.0) |
28.1 (−2.2) |
37.9 (3.3) |
46.5 (8.1) |
45.5 (7.5) |
37.4 (3.0) |
26.5 (−3.1) |
16.5 (−8.6) |
10.3 (−12.1) |
25.2 (−3.8) |
| Mean daily minimum °F (°C) | 1.2 (−17.1) |
−0.9 (−18.3) |
3.2 (−16.0) |
7.5 (−13.6) |
16.0 (−8.9) |
25.0 (−3.9) |
32.6 (0.3) |
31.9 (−0.1) |
24.6 (−4.1) |
15.1 (−9.4) |
7.0 (−13.9) |
1.0 (−17.2) |
13.7 (−10.2) |
| Average precipitation inches (mm) | 3.00 (76) |
3.11 (79) |
3.26 (83) |
3.69 (94) |
3.99 (101) |
2.71 (69) |
1.33 (34) |
1.44 (37) |
2.35 (60) |
2.49 (63) |
3.14 (80) |
3.26 (83) |
33.77 (859) |
| Source: PRISM Climate Group | |||||||||||||


