Arlington, Oregon facts for kids
Quick facts for kids
Arlington, Oregon
|
|
|---|---|
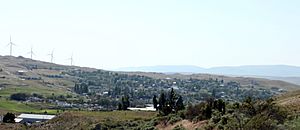
Community of Arlington
|
|
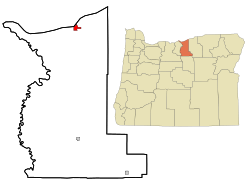
Location in Oregon
|
|
| Country | United States |
| State | Oregon |
| County | Gilliam |
| Incorporated | 1885 |
| Area | |
| • Total | 3.17 sq mi (8.21 km2) |
| • Land | 2.55 sq mi (6.60 km2) |
| • Water | 0.62 sq mi (1.61 km2) |
| Elevation | 285 ft (87 m) |
| Population
(2020)
|
|
| • Total | 628 |
| • Density | 246.27/sq mi (95.10/km2) |
| Time zone | UTC-8 (Pacific) |
| • Summer (DST) | UTC-7 (Pacific) |
| ZIP codes |
97812, 97861
|
| Area code(s) | 541 |
| FIPS code | 41-02800 |
| GNIS feature ID | 2409730 |
| Website | https://www.cityofarlingtonoregon.com/ |
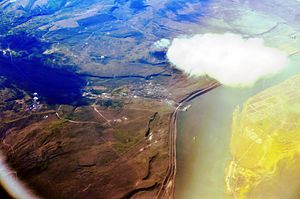
Arlington is a small city in Gilliam County, Oregon, United States. It's located near the Columbia River. In 2020, about 628 people lived there.
Contents
History
The city of Arlington has an interesting past. It was first called Alkali. People aren't sure how it got its current name. Some say it was named after a lawyer named Nathan Arlington Cornish. Others believe it was named after Arlington, Virginia, which was home to General Robert E. Lee.
Arlington started as a place where people would ship cattle down the Columbia River. It officially became a city on November 20, 1885.
In 1963, the city had to move to higher ground. This happened after the John Day Dam was built, which caused the river water to rise.
Geography
Arlington is located in Oregon. The city covers about 2.4 square miles (6.2 square kilometers). Most of this area is land, but some is water.
Climate
Arlington has a semi-arid climate. This means it's generally dry, but not a desert. It gets some rain, but not a lot.
| Climate data for Arlington, Oregon, 1991–2020 normals, extremes 1893–present | |||||||||||||
|---|---|---|---|---|---|---|---|---|---|---|---|---|---|
| Month | Jan | Feb | Mar | Apr | May | Jun | Jul | Aug | Sep | Oct | Nov | Dec | Year |
| Record high °F (°C) | 66 (19) |
74 (23) |
81 (27) |
97 (36) |
107 (42) |
117 (47) |
114 (46) |
115 (46) |
104 (40) |
90 (32) |
84 (29) |
74 (23) |
117 (47) |
| Mean maximum °F (°C) | 56.2 (13.4) |
59.4 (15.2) |
67.8 (19.9) |
79.3 (26.3) |
90.2 (32.3) |
96.4 (35.8) |
103.4 (39.7) |
102.1 (38.9) |
93.8 (34.3) |
79.9 (26.6) |
65.4 (18.6) |
56.7 (13.7) |
104.8 (40.4) |
| Mean daily maximum °F (°C) | 40.8 (4.9) |
46.9 (8.3) |
55.6 (13.1) |
63.7 (17.6) |
73.2 (22.9) |
79.7 (26.5) |
89.5 (31.9) |
88.9 (31.6) |
80.0 (26.7) |
65.5 (18.6) |
50.4 (10.2) |
41.1 (5.1) |
64.6 (18.1) |
| Daily mean °F (°C) | 35.3 (1.8) |
38.7 (3.7) |
45.6 (7.6) |
52.8 (11.6) |
61.7 (16.5) |
68.2 (20.1) |
76.3 (24.6) |
75.5 (24.2) |
66.5 (19.2) |
53.7 (12.1) |
42.4 (5.8) |
35.5 (1.9) |
54.4 (12.4) |
| Mean daily minimum °F (°C) | 29.7 (−1.3) |
30.6 (−0.8) |
35.7 (2.1) |
42.0 (5.6) |
50.1 (10.1) |
56.6 (13.7) |
63.2 (17.3) |
62.0 (16.7) |
53.1 (11.7) |
42.0 (5.6) |
34.4 (1.3) |
29.9 (−1.2) |
44.1 (6.7) |
| Mean minimum °F (°C) | 15.4 (−9.2) |
18.3 (−7.6) |
24.8 (−4.0) |
31.1 (−0.5) |
37.0 (2.8) |
46.2 (7.9) |
52.6 (11.4) |
51.0 (10.6) |
40.9 (4.9) |
28.4 (−2.0) |
20.9 (−6.2) |
16.7 (−8.5) |
8.9 (−12.8) |
| Record low °F (°C) | −18 (−28) |
−21 (−29) |
7 (−14) |
19 (−7) |
26 (−3) |
37 (3) |
42 (6) |
40 (4) |
26 (−3) |
11 (−12) |
−5 (−21) |
−12 (−24) |
−21 (−29) |
| Average precipitation inches (mm) | 1.47 (37) |
0.98 (25) |
0.83 (21) |
0.61 (15) |
0.75 (19) |
0.48 (12) |
0.10 (2.5) |
0.15 (3.8) |
0.33 (8.4) |
0.81 (21) |
1.13 (29) |
1.66 (42) |
9.30 (236) |
| Average snowfall inches (cm) | 2.0 (5.1) |
1.2 (3.0) |
0.2 (0.51) |
0.0 (0.0) |
0.0 (0.0) |
0.0 (0.0) |
0.0 (0.0) |
0.0 (0.0) |
0.0 (0.0) |
0.1 (0.25) |
0.4 (1.0) |
1.4 (3.6) |
5.3 (13.46) |
| Average precipitation days (≥ 0.01 in) | 11.2 | 8.1 | 8.5 | 6.1 | 6.5 | 3.5 | 1.0 | 1.7 | 2.5 | 6.8 | 9.7 | 11.4 | 77.0 |
| Average snowy days (≥ 0.1 in) | 1.7 | 1.4 | 0.2 | 0.0 | 0.0 | 0.0 | 0.0 | 0.0 | 0.0 | 0.0 | 0.3 | 1.8 | 5.4 |
| Source 1: NOAA | |||||||||||||
| Source 2: National Weather Service | |||||||||||||
Demographics
| Historical population | |||
|---|---|---|---|
| Census | Pop. | %± | |
| 1890 | 356 | — | |
| 1900 | 388 | 9.0% | |
| 1910 | 317 | −18.3% | |
| 1920 | 529 | 66.9% | |
| 1930 | 601 | 13.6% | |
| 1940 | 609 | 1.3% | |
| 1950 | 686 | 12.6% | |
| 1960 | 643 | −6.3% | |
| 1970 | 375 | −41.7% | |
| 1980 | 521 | 38.9% | |
| 1990 | 425 | −18.4% | |
| 2000 | 524 | 23.3% | |
| 2010 | 586 | 11.8% | |
| 2020 | 628 | 7.2% | |
| U.S. Decennial Census | |||
In 2010, there were 586 people living in Arlington. There were 256 households, and 149 of them were families.
Most people living in Arlington were White (93.2%). A small number were from other racial backgrounds. About 6.7% of the population was Hispanic or Latino.
The average age of people in Arlington was 43.6 years old. About 21.8% of residents were under 18.
Economy
The land around Arlington is mostly used for farming. Farmers grow crops like wheat and barley. They also raise beef cattle.
Waste disposal
Arlington has a large Waste Management landfill. This landfill receives trash from cities like Seattle, Washington, and Portland, Oregon.
In 2010, Waste Management planned to build a special plant next to the landfill. This plant uses a technology called plasma gasification to turn trash into energy. The plant started working in 2011.
Wind farms
The area around Arlington is home to several large wind farms. These farms use wind turbines to create electricity.
| Station | Location | Capacity (MW) | Status | Notes | No. of turbines |
|---|---|---|---|---|---|
| Willow Creek Wind Farm | Gilliam County and Morrow County | 72 | Operational | 48 | |
| Shepherds Flat Wind Farm | Gilliam County and Morrow County | 845 | Operational | 338 | |
| Rattlesnake Road Wind Farm | Gilliam County | 103 | Operational | 49 | |
| Leaning Juniper Wind Project | Gilliam County | 302.3 | Operational | 200 | |
| Pebble Springs Wind Farm | Gilliam County | 99 | Operational | 47 | |
| Wheatfield Wind Farm | Gilliam County | 97 | Operational | 46 | |
| Montague Wind Power Facility | Gilliam County | Phase 1 - 201 (Proposed - 404) | Operational | Phase 1 - 56
112-269 |
|
| Saddle Butte Wind - Four Mile Wind | Gilliam County and Morrow County | 399 | Proposed | 133 |
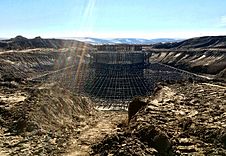
Caithness Energy built the Shepherds Flat Wind Farm. It's one of the biggest land-based wind farms in the world. Construction began in 2009, and it started working fully in November 2012.
Another project is the Montague Wind Power Project. This wind farm is owned by Avangrid Renewables. It provides power to Apple Inc.'s data center in Prineville, Oregon.
There have also been plans for several solar farms in the area. In 2020, Avangrid asked to divide the Montague Wind Power Facility into three parts: Montague Wind, Montague Solar, and Oregon Trail Solar.
Transportation
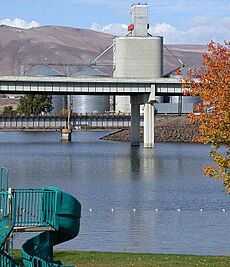
Arlington is located where Interstate 84 and Oregon Route 19 meet. Interstate 84 goes west towards Portland and east towards Boise, Idaho. Oregon Route 19 connects Arlington to Condon.
The Port of Arlington provides access to the Columbia River. It has:
- a marina with a fuel dock and places for boats to stop.
- a river terminal for shipping goods.
- a launch area for windsurfing and kiteboarding.
The city also has a small airport called Arlington Municipal Airport. In 2011, the U.S. Air Force suggested Arlington as a possible location for a future base for unmanned aerial vehicles (drones).
Notable people
- Doc Severinsen, a famous jazz musician and big band leader.
Public services
- Arlington Health Clinic
- North Gilliam Medic
- North Gilliam Rural Fire Protection District
- Gilliam County Sheriff's Office
Churches
- Arlington United Methodist Church
- Arlington Church of the Nazarene
- St. Francis Catholic Church
See Also
 In Spanish: Arlington (Oregón) para niños
 | Toni Morrison |
 | Barack Obama |
 | Martin Luther King Jr. |
 | Ralph Bunche |


