Coquille, Oregon facts for kids
Quick facts for kids
Coquille, Oregon
|
||
|---|---|---|
|
||

Location in Oregon
|
||
| Country | United States | |
| State | Oregon | |
| County | Coos | |
| Incorporated | 1885 | |
| Area | ||
| • Total | 2.80 sq mi (7.26 km2) | |
| • Land | 2.76 sq mi (7.16 km2) | |
| • Water | 0.04 sq mi (0.10 km2) | |
| Elevation | 62 ft (19 m) | |
| Population
(2020)
|
||
| • Total | 4,015 | |
| • Density | 1,452.60/sq mi (560.89/km2) | |
| Time zone | UTC−8 (Pacific) | |
| • Summer (DST) | UTC−7 (Pacific) | |
| ZIP code |
97423
|
|
| Area code(s) | 541 | |
| FIPS code | 41-15350 | |
| GNIS feature ID | 2410226 | |
| Website | www.cityofcoquille.org | |
Coquille (say it like "koh-KEEL") is a friendly city in Oregon, USA. It's the main town, or "county seat," of Coos County. In 2020, about 4,015 people lived here. The city is mostly known for its timber industry, which means working with wood and forests. Coquille got its name from the Coquille Native American tribe, who lived in this area long ago.
Contents
Coquille's Location and Weather
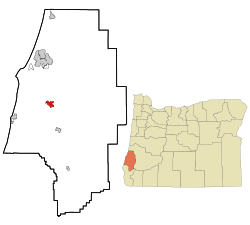
Coquille is located in Oregon, near the Coquille River. This river flows from the Coastal Mountains all the way to the Pacific Ocean at Bandon. The city covers about 2.8 square miles (7.26 square kilometers) of land and water.
Coquille's Climate
Coquille has a special kind of weather called a "warm-summer Mediterranean climate." This means it has warm, dry summers and mild, wet winters. The hottest temperature ever recorded was 107°F (41.7°C) on August 15, 2020. The coldest was 8°F (-13.3°C) on December 22, 1990. On average, it gets above 90°F (32.2°C) about one or two days a year. It freezes (32°F or 0°C or lower) about 37 times a year.
| Climate data for Coquille, Oregon, 1991–2020 normals, extremes 1971–present | |||||||||||||
|---|---|---|---|---|---|---|---|---|---|---|---|---|---|
| Month | Jan | Feb | Mar | Apr | May | Jun | Jul | Aug | Sep | Oct | Nov | Dec | Year |
| Record high °F (°C) | 74 (23) |
85 (29) |
83 (28) |
91 (33) |
97 (36) |
96 (36) |
98 (37) |
107 (42) |
104 (40) |
102 (39) |
79 (26) |
73 (23) |
107 (42) |
| Mean maximum °F (°C) | 67.2 (19.6) |
70.8 (21.6) |
72.4 (22.4) |
76.5 (24.7) |
80.1 (26.7) |
80.8 (27.1) |
82.1 (27.8) |
83.4 (28.6) |
87.6 (30.9) |
83.2 (28.4) |
72.4 (22.4) |
64.6 (18.1) |
91.4 (33.0) |
| Mean daily maximum °F (°C) | 54.7 (12.6) |
56.5 (13.6) |
57.9 (14.4) |
60.4 (15.8) |
64.6 (18.1) |
68.3 (20.2) |
72.2 (22.3) |
73.6 (23.1) |
73.0 (22.8) |
67.0 (19.4) |
58.8 (14.9) |
53.6 (12.0) |
63.4 (17.4) |
| Daily mean °F (°C) | 45.9 (7.7) |
46.9 (8.3) |
48.2 (9.0) |
50.6 (10.3) |
54.8 (12.7) |
58.3 (14.6) |
61.9 (16.6) |
62.5 (16.9) |
60.4 (15.8) |
55.1 (12.8) |
49.3 (9.6) |
45.0 (7.2) |
53.2 (11.8) |
| Mean daily minimum °F (°C) | 37.1 (2.8) |
37.3 (2.9) |
38.6 (3.7) |
40.7 (4.8) |
44.9 (7.2) |
48.4 (9.1) |
51.5 (10.8) |
51.4 (10.8) |
47.7 (8.7) |
43.2 (6.2) |
39.8 (4.3) |
36.4 (2.4) |
43.1 (6.1) |
| Mean minimum °F (°C) | 27.5 (−2.5) |
28.6 (−1.9) |
30.4 (−0.9) |
32.8 (0.4) |
36.1 (2.3) |
40.8 (4.9) |
44.8 (7.1) |
44.5 (6.9) |
39.8 (4.3) |
33.1 (0.6) |
28.7 (−1.8) |
26.2 (−3.2) |
23.3 (−4.8) |
| Record low °F (°C) | 12 (−11) |
11 (−12) |
25 (−4) |
26 (−3) |
30 (−1) |
34 (1) |
39 (4) |
37 (3) |
31 (−1) |
24 (−4) |
18 (−8) |
8 (−13) |
8 (−13) |
| Average precipitation inches (mm) | 8.72 (221) |
6.61 (168) |
7.06 (179) |
5.01 (127) |
2.73 (69) |
1.44 (37) |
0.34 (8.6) |
0.37 (9.4) |
1.26 (32) |
3.65 (93) |
7.66 (195) |
10.01 (254) |
54.86 (1,393) |
| Average snowfall inches (cm) | 0.1 (0.25) |
0.0 (0.0) |
0.0 (0.0) |
0.0 (0.0) |
0.0 (0.0) |
0.0 (0.0) |
0.0 (0.0) |
0.0 (0.0) |
0.0 (0.0) |
0.0 (0.0) |
0.0 (0.0) |
0.1 (0.25) |
0.2 (0.51) |
| Average precipitation days (≥ 0.01 in) | 20.2 | 17.7 | 19.4 | 18.0 | 12.7 | 9.0 | 3.3 | 3.5 | 6.4 | 13.2 | 19.7 | 20.2 | 163.3 |
| Average snowy days (≥ 0.1 in) | 0.1 | 0.0 | 0.0 | 0.0 | 0.0 | 0.0 | 0.0 | 0.0 | 0.0 | 0.0 | 0.0 | 0.0 | 0.1 |
| Source 1: NOAA | |||||||||||||
| Source 2: National Weather Service | |||||||||||||
People of Coquille
| Historical population | |||
|---|---|---|---|
| Census | Pop. | %± | |
| 1870 | 100 | — | |
| 1880 | 176 | 76.0% | |
| 1890 | 494 | 180.7% | |
| 1900 | 728 | 47.4% | |
| 1910 | 1,398 | 92.0% | |
| 1920 | 1,642 | 17.5% | |
| 1930 | 2,732 | 66.4% | |
| 1940 | 3,327 | 21.8% | |
| 1950 | 3,523 | 5.9% | |
| 1960 | 4,370 | 24.0% | |
| 1970 | 4,437 | 1.5% | |
| 1980 | 4,481 | 1.0% | |
| 1990 | 4,121 | −8.0% | |
| 2000 | 4,184 | 1.5% | |
| 2010 | 3,866 | −7.6% | |
| 2020 | 4,015 | 3.9% | |
| source: | |||
Coquille's Population in 2010
In 2010, there were 3,866 people living in Coquille. These people lived in 1,640 homes, with 1,036 of them being families. Most people (92.5%) were White. Other groups included Native American (1.9%), Asian (0.5%), and African American (0.4%). About 5.3% of the population was Hispanic or Latino.
About one-fourth (26.7%) of the homes had children under 18. Almost half (48%) were married couples. About 15.4% of homes had someone aged 65 or older living alone. The average age in the city was about 45.5 years old.
Fun Things to See and Do in Coquille
- Coquille Valley Museum: This museum opened in 2005. It's a great place to learn about the area's history. You can see old tools, antiques, books, and photos.
- Sawdust Theatre: If you visit in the summer, you might catch a fun show! Local volunteers perform old-fashioned plays called melodramas here. The theater first opened in 1966. It burned down in 1994 but was rebuilt and reopened in 2000.
- Old City Hall Art Gallery: The old City Hall building, built in 1912, has been brought back to life! Its owners, Nella and Steve Abbott, have turned it into an art gallery. It shows art made by prisoners.
Learning in Coquille
The Coquille School District helps kids from kindergarten all the way through 12th grade.
- Elementary Schools:
- Lincoln School of Early Learning
- Coquille Valley Elementary
- Winter Lakes Elementary School
- High Schools:
- Winter Lakes High School
- Coquille Junior Senior High
For students who want to continue their education after high school, Southwestern Oregon Community College is nearby in Coos Bay. It offers two-year degrees and other programs.
See also
 In Spanish: Coquille (Oregón) para niños
 | Aurelia Browder |
 | Nannie Helen Burroughs |
 | Michelle Alexander |


