
Diagram facts for kids

A diagram is a picture that helps explain something. It's usually a flat drawing that uses shapes, lines, and symbols to show how things are connected or how they work. Diagrams make complex ideas, information, or data easier to understand. You can find them everywhere, from science textbooks to instructions for building a toy. They help us see relationships and patterns that might be hard to grasp just by reading words.
Contents
What is a Diagram?

Diagrams are a special way to show information visually. Think of them like a map for ideas!
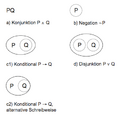
- Visual Information: Sometimes, a diagram is a general term for any technical drawing. This includes things like graphs, technical drawings, and tables that organize data.
- Specific Visual Display: Other times, a diagram means a specific type of drawing. This type uses shapes connected by lines or arrows to show how different parts relate to each other. It's great for showing steps in a process or how different ideas link up.
For example, a map is a type of diagram that shows places and how they connect. A blueprint for a building is also a diagram, showing how different parts of the building fit together. Diagrams are different from photos or videos because they simplify things and focus on the important connections, not every tiny detail.
How Diagrams Help Us Think

Diagrams are powerful tools because they connect with how our brains naturally understand the world. Our brains are amazing at processing visual information without us even trying. When you look around, your brain instantly creates a picture of your surroundings. Diagrams use these natural abilities.
Sometimes, we can see how our brains work when we look at optical illusions. For example, the Kanizsa triangle makes you see a white triangle even though it's not actually drawn. This shows how your brain fills in gaps and creates meaning from what it sees.
Diagrams can even spark new ideas! A famous example is Dmitri Mendeleev's periodic table of elements. This diagram organized all the known chemical elements. But even more amazing, it helped scientists predict the properties of elements that hadn't even been discovered yet! It showed where those missing elements should fit, guiding new research.
Common Types of Diagrams
There are many different kinds of diagrams, each good for showing different types of information:
- Flowcharts: Show the steps in a process or decision.
- Tree diagrams: Show how things branch out, like a family tree or different options.
- Network diagrams: Show how different things are connected, like computers in a network.
- Graphs: Show relationships between numbers, like how something changes over time.
- Venn diagrams: Show how different groups overlap or are separate.
- Mind maps: Help you organize your thoughts and ideas for learning or brainstorming.
Examples of Diagrams
Here are some specific examples of diagrams you might see:
- Circuit diagram: Shows how electrical parts are connected in a device.
- Gantt chart: Used in project management to show when tasks start and end.
- Organization chart: Shows the structure of a company or team.
- Piping and instrumentation diagram: Used in engineering to show how pipes and instruments are laid out.
Main Diagram Categories
Diagrams can often be grouped into a few main types based on how they show information:
- Graph-based diagrams: These diagrams show relationships by connecting items or showing overlaps between them.
|


- Chart-like diagrams: These display how two different things relate to each other, often using numbers or measurements.


Other types of diagrams include schematics and more specialized visual tools:
|


Images for kids
-
Existential graph
-
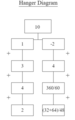
Hanger diagram.


See also
 In Spanish: Diagrama para niños
