Lake Coleridge facts for kids
Quick facts for kids Lake Coleridge |
|
|---|---|

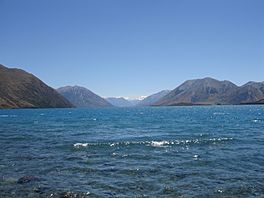
Lake Coleridge looking north-west from the southern end.
|
|
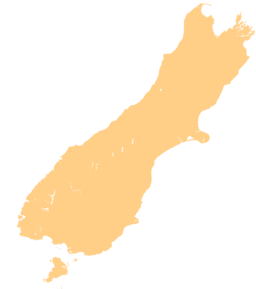
| Location | Selwyn District, Canterbury region, South Island |
| Coordinates | 43°17′S 171°30′E / 43.283°S 171.500°E |
| Native name | Whakamatau (Māori) |
| Primary inflows | Harper, Wilberforce, Acheron |
| Primary outflows | Rakaia River (via Coleridge Power Station) |
| Basin countries | New Zealand |
| Max. length | 11 km (6.8 mi) |
| Max. width | 4.8 km (3.0 mi) |
| Surface area | 47 km2 (18 sq mi) |
| Max. depth | 200 m (660 ft) |
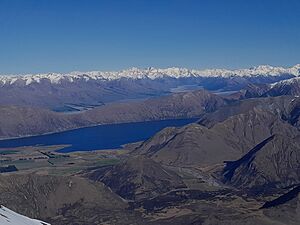
Lake Coleridge (which Māori people call Whakamatau) is a beautiful lake in the South Island of New Zealand. It's located in the Canterbury region, about 35 kilometers (22 miles) northwest of Methven. This large lake covers an area of 47 square kilometers (18 square miles). It was formed over 20,000 years ago by a huge glacier during the Pleistocene Ice Age. Today, a small community lives near the lake.
Contents
Lake Life: Plants and Animals
The ecology of a place is all about the living things there and how they interact. When early European explorers first saw Lake Coleridge, its shores were covered in many native plants. These included mānuka and kānuka trees, bright yellow kōwhai trees, tall cabbage trees, and flax plants. The lake was also surrounded by Southern Rata trees and native beech trees. The lake itself did not have many water plants because there were not many nutrients in the water. However, it was well-known for its population of large eels.
Over time, human activities have greatly changed the lake's environment. Settlers brought in new types of fish for sport, such as rainbow trout, brown trout, Atlantic salmon, and Chinook salmon. The way the Coleridge Power Station works causes the lake's water levels to change. These changes killed most of the kānuka trees in 1914 and the rata trees in 1923. Today, a mix of native and introduced plants grow around the lake. These include matagouri, broom, gorse, briar, coprosma, and biddi-biddi.
Lake Coleridge's Past

The history of Lake Coleridge is very interesting, showing how the land was formed and how people have lived there over many centuries.
How the Lake Was Formed
The area where Lake Coleridge sits was shaped by powerful glaciers. These huge ice sheets carved out the valley during several ice ages, including the Waimaungan, Waimean, and Otiran glaciations. The lake is also located near several important fault-lines in the Earth's crust. These include the Porters Pass Fault, the Cass Fault, and the Blue Hill Fault.
Māori History and Use
There is proof that Māori have been active in the Lake Coleridge area for a very long time, possibly since the 13th century. Archaeologists have found old campfires and moa bones nearby. These findings have been dated to between 1340 and 1420 AD using carbon dating.
At first, the area was covered in thick forests. However, large fires destroyed most of this plant life between 1200 and 1400. Later, the lake became a very important stopping place for Māori tribes who lived on the coast. They made difficult journeys between the east and West Coast of the South Island to get pounamu (greenstone). Lake Coleridge was a great place to rest and gather food because it had many eels, weka (a type of bird), and water fowl. This helped them get ready for their long and challenging travels.
European Settlers and Modern Times
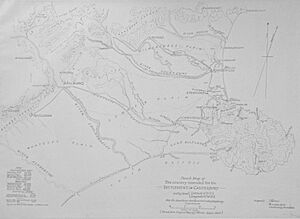
The lake was given its name by Joseph Thomas, who was the chief surveyor for the Canterbury Association. He named it on a map he drew in early 1849. The name honors two early members of the Canterbury Association, Edward Coleridge and William Coleridge. They were cousins and also nephews of the famous poet Samuel Taylor Coleridge.
Lake Coleridge is home to one of New Zealand's very first hydroelectric schemes. This is a way of making electricity using the power of moving water. The Coleridge Power Station was finished in 1914. It was built mainly to provide electricity to the city of Christchurch. The power station works by using the big difference in height between the lake and the nearby river; the lake is 150 meters (490 feet) higher than the river. To make more power, some of the water from the Harper and Wilberforce rivers has been sent into the lake. In fact, up to 100% of the Harper River's water can be diverted for the power station. This power station is still working today!

On June 26, 1946, a strong earthquake with a magnitude of 6.5 happened. Its center was right at Lake Coleridge.
Climate
The climate around Lake Coleridge varies throughout the year. Summers are generally warm, while winters can be quite cold, sometimes dropping below freezing. The area receives a good amount of rainfall, especially in the winter months.
| Climate data for Lake Coleridge, elevation 364 m (1,194 ft), (1981–2010) | |||||||||||||
|---|---|---|---|---|---|---|---|---|---|---|---|---|---|
| Month | Jan | Feb | Mar | Apr | May | Jun | Jul | Aug | Sep | Oct | Nov | Dec | Year |
| Mean daily maximum °C (°F) | 22.4 (72.3) |
22.0 (71.6) |
20.2 (68.4) |
17.3 (63.1) |
13.9 (57.0) |
10.6 (51.1) |
10.0 (50.0) |
11.8 (53.2) |
14.5 (58.1) |
16.2 (61.2) |
18.4 (65.1) |
20.4 (68.7) |
16.5 (61.7) |
| Daily mean °C (°F) | 16.2 (61.2) |
15.9 (60.6) |
14.2 (57.6) |
11.3 (52.3) |
8.2 (46.8) |
5.5 (41.9) |
4.7 (40.5) |
6.3 (43.3) |
8.7 (47.7) |
10.6 (51.1) |
12.6 (54.7) |
14.5 (58.1) |
10.7 (51.3) |
| Mean daily minimum °C (°F) | 10.0 (50.0) |
9.7 (49.5) |
8.1 (46.6) |
5.3 (41.5) |
2.5 (36.5) |
0.3 (32.5) |
−0.6 (30.9) |
0.7 (33.3) |
2.9 (37.2) |
5.0 (41.0) |
6.7 (44.1) |
8.6 (47.5) |
4.9 (40.9) |
| Average rainfall mm (inches) | 57.1 (2.25) |
37.4 (1.47) |
60.1 (2.37) |
67.1 (2.64) |
55.7 (2.19) |
74.7 (2.94) |
80.2 (3.16) |
97.8 (3.85) |
90.5 (3.56) |
80.4 (3.17) |
66.5 (2.62) |
56.4 (2.22) |
823.9 (32.44) |
| Source: NIWA (rain 1991–2020) | |||||||||||||
| Climate data for Harper River, elevation 533 m (1,749 ft), (1991–2020) | |||||||||||||
|---|---|---|---|---|---|---|---|---|---|---|---|---|---|
| Month | Jan | Feb | Mar | Apr | May | Jun | Jul | Aug | Sep | Oct | Nov | Dec | Year |
| Mean daily maximum °C (°F) | 21.2 (70.2) |
21.7 (71.1) |
19.0 (66.2) |
16.0 (60.8) |
13.2 (55.8) |
9.9 (49.8) |
9.3 (48.7) |
10.8 (51.4) |
12.9 (55.2) |
14.9 (58.8) |
16.6 (61.9) |
19.3 (66.7) |
15.4 (59.7) |
| Daily mean °C (°F) | 15.4 (59.7) |
15.5 (59.9) |
13.2 (55.8) |
10.5 (50.9) |
8.2 (46.8) |
5.2 (41.4) |
4.4 (39.9) |
5.8 (42.4) |
7.8 (46.0) |
9.6 (49.3) |
11.3 (52.3) |
13.7 (56.7) |
10.0 (50.1) |
| Mean daily minimum °C (°F) | 9.6 (49.3) |
9.3 (48.7) |
7.5 (45.5) |
5.1 (41.2) |
3.2 (37.8) |
0.6 (33.1) |
−0.6 (30.9) |
0.8 (33.4) |
2.7 (36.9) |
4.3 (39.7) |
6.0 (42.8) |
8.1 (46.6) |
4.7 (40.5) |
| Average rainfall mm (inches) | 89.1 (3.51) |
54.7 (2.15) |
90.4 (3.56) |
77.2 (3.04) |
91.5 (3.60) |
136.9 (5.39) |
86.0 (3.39) |
130.5 (5.14) |
119.7 (4.71) |
126.3 (4.97) |
125.6 (4.94) |
92.9 (3.66) |
1,220.8 (48.06) |
| Source: NIWA | |||||||||||||
 | James B. Knighten |
 | Azellia White |
 | Willa Brown |


