Richland County, Illinois facts for kids
Quick facts for kids
Richland County
|
|
|---|---|

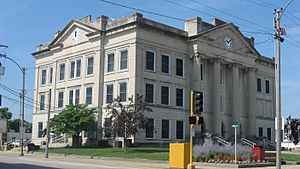
Richland County Courthouse in Olney
|
|

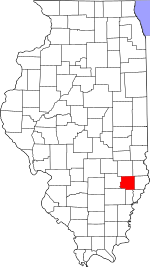
Location within the U.S. state of Illinois
|
|
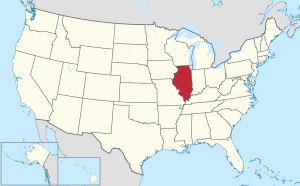
 Illinois's location within the U.S. |
|
| Country | |
| State | |
| Founded | February 24, 1841 |
| Named for | Richland County, Ohio |
| Seat | Olney |
| Largest city | Olney |
| Area | |
| • Total | 362 sq mi (940 km2) |
| • Land | 356 sq mi (920 km2) |
| • Water | 1.9 sq mi (5 km2) 0.5% |
| Population
(2020)
|
|
| • Total | 15,813 |
| • Estimate
(2021)
|
15,796 |
| • Density | 43.68/sq mi (16.866/km2) |
| Time zone | UTC−6 (Central) |
| • Summer (DST) | UTC−5 (CDT) |
| Congressional district | 12th |
Richland County is a county located in the state of Illinois, in the United States. It's a place where about 15,813 people lived in 2020. The main town and county seat (which is like the county's capital) is Olney.
Contents
History of Richland County
Richland County was created on February 24, 1841. It was formed from parts of two other counties: the eastern part of Clay County and the western part of Lawrence County. The county got its name from Richland County, Ohio. Many of the first people who settled here came from that area in Ohio.
Geography and Climate
Richland County covers a total area of about 362 square miles. Most of this area, about 360 square miles, is land. The rest, about 1.9 square miles, is water.
Weather in Richland County
| Weather chart for Olney, Illinois | |||||||||||||||||||||||||||||||||||||||||||||||
|---|---|---|---|---|---|---|---|---|---|---|---|---|---|---|---|---|---|---|---|---|---|---|---|---|---|---|---|---|---|---|---|---|---|---|---|---|---|---|---|---|---|---|---|---|---|---|---|
| J | F | M | A | M | J | J | A | S | O | N | D | ||||||||||||||||||||||||||||||||||||
|
2.8
36
19
|
2.7
42
23
|
4.4
54
32
|
4.4
65
42
|
4.8
75
52
|
4.1
84
62
|
4.1
88
66
|
3.6
86
63
|
3.1
80
55
|
3.3
69
44
|
4.4
54
34
|
3.7
41
24
|
||||||||||||||||||||||||||||||||||||
| temperatures in °F precipitation totals in inches source: The Weather Channel |
|||||||||||||||||||||||||||||||||||||||||||||||
|
Metric conversion
|
|||||||||||||||||||||||||||||||||||||||||||||||
The weather in Olney, the county seat, changes throughout the year. In January, the average low temperature is around 19°F. In July, the average high temperature reaches about 88°F. The coldest temperature ever recorded was -25°F in February 1951. The hottest was 112°F in July 1936.
Rainfall also varies. February usually has the least rain, about 2.73 inches. May tends to be the wettest month, with about 4.76 inches of rain.
Getting Around Richland County
You can get around Richland County using different ways.
Public Transportation
- Rides Mass Transit District
Main Roads
Neighboring Counties
Richland County shares its borders with several other counties:
- Jasper County (to the north)
- Crawford County (to the northeast)
- Lawrence County (to the east)
- Wabash County (to the southeast)
- Edwards County (to the south)
- Wayne County (to the southwest)
- Clay County (to the west)
Population of Richland County
| Historical population | |||
|---|---|---|---|
| Census | Pop. | %± | |
| 1850 | 4,012 | — | |
| 1860 | 9,711 | 142.0% | |
| 1870 | 12,803 | 31.8% | |
| 1880 | 15,545 | 21.4% | |
| 1890 | 15,019 | −3.4% | |
| 1900 | 16,391 | 9.1% | |
| 1910 | 15,970 | −2.6% | |
| 1920 | 14,044 | −12.1% | |
| 1930 | 14,053 | 0.1% | |
| 1940 | 17,137 | 21.9% | |
| 1950 | 16,889 | −1.4% | |
| 1960 | 16,299 | −3.5% | |
| 1970 | 16,829 | 3.3% | |
| 1980 | 17,587 | 4.5% | |
| 1990 | 16,545 | −5.9% | |
| 2000 | 16,149 | −2.4% | |
| 2010 | 16,233 | 0.5% | |
| 2020 | 15,813 | −2.6% | |
| 2023 (est.) | 15,488 | −4.6% | |
| U.S. Decennial Census 1790–1960 1900–1990 1990–2000 2010–2013 2020 |
|||
In 2010, there were 16,233 people living in Richland County. By 2020, this number had slightly decreased to 15,813 people. The county has about 43 people living per square mile.
Most people in Richland County are white. There are also smaller groups of Asian, Black or African American, and American Indian residents. Some people are from other races or have mixed backgrounds. About 1.7% of the population is of Hispanic or Latino origin.
The average age of people in Richland County is about 42 years old. Families in the county earn a median income of around $53,853 per year. Richland County is known for being one of the most affordable places in Illinois to buy a car.
Communities in Richland County
Richland County has one city, several villages, and some smaller unincorporated communities. It is also divided into nine townships.
City
- Olney (This is the county seat)
Villages
Unincorporated Communities
These are smaller places that are not officially organized as cities or villages.
- Berryville
- Dundas
- Elbow
- Wynoose
Townships
Richland County is divided into nine areas called townships:
- Bonpas
- Claremont
- Decker
- Denver
- German
- Madison
- Noble
- Olney
- Preston
Notable People from Richland County
- Alexander W. Swanitz (1851–1915), a civil engineer who helped build railroads across the country.
- Dial D. Ryder (1938–2011), a skilled gun smith.
See also
 In Spanish: Condado de Richland (Illinois) para niños


