Warooka, South Australia facts for kids
Quick facts for kids WarookaSouth Australia |
|||||||||||||||
|---|---|---|---|---|---|---|---|---|---|---|---|---|---|---|---|

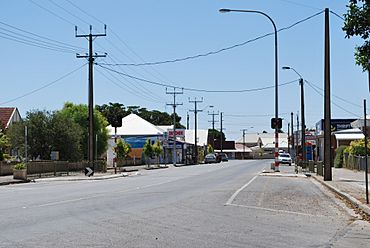
Main street
|
|||||||||||||||
| Postcode(s) | 5577 | ||||||||||||||
| Location | |||||||||||||||
| LGA(s) | Yorke Peninsula Council | ||||||||||||||
| State electorate(s) | Narungga | ||||||||||||||
| Federal Division(s) | Grey | ||||||||||||||
|
|||||||||||||||
|
|||||||||||||||
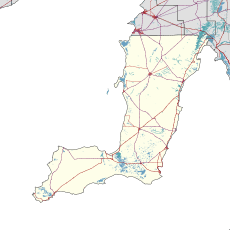
Warooka is a small town located on the Yorke Peninsula in South Australia. It's often called the 'Gateway to the bottom end' of the peninsula. This means it's a key starting point for exploring the southern parts of this beautiful area.
Warooka is about 230 kilometers west of Adelaide, the capital city of South Australia. It's a quiet place, perfect for those who love nature and coastal adventures.
What is Warooka's Climate Like?
Warooka has a special type of weather called a warm-summer mediterranean climate. This means it has warm, dry summers and mild, somewhat wet winters. It's similar to the climate found in places around the Mediterranean Sea.
You can see more details about Warooka's weather in the table below. It shows the average temperatures and rainfall throughout the year.
| Climate data for Warooka (34º59'S, 137º24'E, 53 m AMSL) (1951-2023 normals and extremes, rainfall 1861-2024) | |||||||||||||
|---|---|---|---|---|---|---|---|---|---|---|---|---|---|
| Month | Jan | Feb | Mar | Apr | May | Jun | Jul | Aug | Sep | Oct | Nov | Dec | Year |
| Record high °C (°F) | 44.1 (111.4) |
41.6 (106.9) |
39.3 (102.7) |
33.5 (92.3) |
29.0 (84.2) |
23.2 (73.8) |
21.6 (70.9) |
23.6 (74.5) |
30.6 (87.1) |
36.4 (97.5) |
40.6 (105.1) |
41.0 (105.8) |
44.1 (111.4) |
| Mean daily maximum °C (°F) | 27.3 (81.1) |
27.0 (80.6) |
25.1 (77.2) |
22.1 (71.8) |
18.5 (65.3) |
15.9 (60.6) |
15.0 (59.0) |
15.7 (60.3) |
17.9 (64.2) |
20.8 (69.4) |
23.5 (74.3) |
25.6 (78.1) |
21.2 (70.2) |
| Mean daily minimum °C (°F) | 15.6 (60.1) |
16.0 (60.8) |
14.7 (58.5) |
12.6 (54.7) |
10.5 (50.9) |
8.6 (47.5) |
7.6 (45.7) |
7.7 (45.9) |
8.7 (47.7) |
10.2 (50.4) |
12.1 (53.8) |
13.8 (56.8) |
11.5 (52.7) |
| Record low °C (°F) | 8.1 (46.6) |
9.0 (48.2) |
7.6 (45.7) |
5.6 (42.1) |
3.8 (38.8) |
2.1 (35.8) |
0.6 (33.1) |
2.4 (36.3) |
2.0 (35.6) |
2.6 (36.7) |
4.2 (39.6) |
6.2 (43.2) |
0.6 (33.1) |
| Average precipitation mm (inches) | 14.6 (0.57) |
17.3 (0.68) |
16.2 (0.64) |
32.9 (1.30) |
53.9 (2.12) |
64.4 (2.54) |
65.0 (2.56) |
59.0 (2.32) |
45.6 (1.80) |
35.0 (1.38) |
22.6 (0.89) |
18.1 (0.71) |
444.2 (17.49) |
| Average precipitation days (≥ 1.0 mm) | 1.9 | 1.9 | 2.3 | 4.7 | 7.8 | 9.3 | 10.5 | 10.1 | 7.4 | 5.4 | 3.5 | 2.9 | 67.7 |
| Average afternoon relative humidity (%) | 42 | 44 | 47 | 52 | 62 | 68 | 68 | 64 | 59 | 50 | 44 | 43 | 54 |
| Average dew point °C (°F) | 10.9 (51.6) |
11.7 (53.1) |
10.9 (51.6) |
9.9 (49.8) |
9.6 (49.3) |
8.7 (47.7) |
7.9 (46.2) |
7.7 (45.9) |
7.9 (46.2) |
7.8 (46.0) |
8.1 (46.6) |
9.5 (49.1) |
9.2 (48.6) |
| Source: Bureau of Meteorology | |||||||||||||
 | Isaac Myers |
 | D. Hamilton Jackson |
 | A. Philip Randolph |


