
Local government areas of South Australia facts for kids
Local government in South Australia is all about how towns and districts manage their own areas. Think of it like your local council! They help look after things like parks, roads, and rubbish collection. This is allowed by a special rule in the Constitution Act 1934 (SA).
Contents
Local Councils Across South Australia
These local councils are often called Local Government Areas (LGAs). They are set up and run according to the Local Government Act 1999 in South Australia. These areas are grouped into different regions by the Local Government Association of South Australia.
Metropolitan Adelaide
This region covers the main city of Adelaide and its surrounding suburbs. Here are some of the councils in this busy area:
| Local Council | Main Office | Year Started | Land Area | Population (2015) | Map | ||
|---|---|---|---|---|---|---|---|
| km² | sq mi | Density | |||||
| City of Adelaide | Adelaide | 1840 | 16 | 6 | 1,448 | 23,169 |  |
| Adelaide Hills Council | Woodside | 1997 | 795 | 307 | 50 | 40,031 |  |
| City of Burnside | Tusmore | 1856 | 27 | 10 | 1,668 | 45,034 |  |
| City of Campbelltown | Rostrevor | 1867 | 24 | 9 | 2,162 | 51,889 |  |
| City of Charles Sturt | Woodville | 1997 | 52 | 20 | 2,196 | 114,209 |  |
| Town of Gawler | Gawler | 1857 | 41 | 16 | 552 | 22,618 |  |
| City of Holdfast Bay | Brighton | 1997 | 13 | 5 | 2,866 | 37,263 |  |
| City of Marion | Sturt | 1886 | 56 | 22 | 1,589 | 88,983 |  |
| City of Mitcham | Torrens Park | 1853 | 76 | 29 | 873 | 66,347 |  |
| City of Norwood Payneham & St Peters | Norwood | 1997 | 15 | 6 | 2,490 | 37,350 |  |
| City of Onkaparinga | Noarlunga Centre | 1997 | 518 | 200 | 326 | 168,798 |  |
| City of Playford | Elizabeth | 1997 | 345 | 133 | 256 | 88,222 |  |
| City of Port Adelaide Enfield | Port Adelaide | 1997 | 97 | 37 | 1,276 | 123,754 |  |
| City of Prospect | Prospect | 1872 | 8 | 3 | 2,677 | 21,416 |  |
| City of Salisbury | Salisbury | 1933 | 158 | 61 | 877 | 138,535 |  |
| City of Tea Tree Gully | Modbury | 1935 | 95 | 37 | 1,041 | 98,861 |  |
| City of Unley | Unley | 1906 | 14 | 5 | 2,809 | 39,324 |  |
| Town of Walkerville | Gilberton | 1855 | 4 | 2 | 1,918 | 7,673 |  |
| City of West Torrens | Hilton | 1856 | 37 | 14 | 1,594 | 58,964 |  |
Regional South Australia
Outside of Adelaide, there are many other local government areas that help manage towns and rural communities.
Eyre Peninsula
This region is on a large peninsula in South Australia.
| Local Council | Main Office | Year Started | Land Area | Population (2015) | Map | |
|---|---|---|---|---|---|---|
| km² | sq mi | |||||
| District Council of Ceduna | Ceduna | 1896 | 5,427 | 2,095 | 3,716 |  |
| District Council of Cleve | Cleve | 1911 | 4,507 | 1,740 | 1,795 |  |
| District Council of Elliston | Elliston | 1887 | 6,500 | 2,510 | 1,066 |  |
| District Council of Franklin Harbour | Cowell | 1888 | 3,583 | 1,383 | 1,234 |  |
| District Council of Kimba | Kimba | 1924 | 3,986 | 1,539 | 1,097 |  |
| District Council of Lower Eyre Peninsula | Cummins | 1921 | 4,771 | 1,842 | 5,087 |  |
| City of Port Augusta | Port Augusta | 1964 | 1,153 | 445 | 14,522 |  |
| City of Port Lincoln | Port Lincoln | 1921 | 30 | 12 | 14,984 |  |
| District Council of Streaky Bay | Streaky Bay | 1887 | 6,232 | 2,406 | 2,249 |  |
| District Council of Tumby Bay | Tumby Bay | 1906 | 2,616 | 1,010 | 2,668 |  |
| Wudinna District Council | Wudinna | 1925 | 5,394 | 2,083 | 1,282 |  |
| City of Whyalla | Whyalla | 1970 | 1,033 | 399 | 22,759 |  |
Central Region
This region includes areas north of Adelaide, often known for farming and wine.
| Local Council | Main Office | Year Started | Land Area | Population (2006 census) | Map | |
|---|---|---|---|---|---|---|
| km² | sq mi | |||||
| Adelaide Plains Council | Mallala | 932 | 360 | 8,385 |  |
|
| Barossa Council | Angaston | 1996 | 912 | 352 | 22,514 |  |
| District Council of Barunga West | Port Broughton | 2,631 |  |
|||
| District Council of Clare and Gilbert Valleys | Clare | 1997 | 8,743 |  |
||
| District Council of the Copper Coast | Kadina | 1997 | 773 | 298 | 12,901 |  |
| Flinders Ranges Council | Quorn | 4,198 | 1,621 | 1,784 |  |
|
| Regional Council of Goyder | Burra | 1997 | 6,719 | 2,594 | 4,285 |  |
| Light Regional Council | Kapunda | 1,278 | 493 | 13,658 |  |
|
| District Council of Mount Remarkable | Melrose | 1980 | 3,425 | 1,322 | 2,951 |  |
| Northern Areas Council | 1997 | 4,866 |  |
|||
| District Council of Orroroo Carrieton | 938 |  |
||||
| District Council of Peterborough | Peterborough | |||||
| Port Pirie Regional Council | Port Pirie | 1997 | 1,761 | 680 | 18,076 |  |
| Wakefield Regional Council | Balaklava | 1997 | 3,469 | 1,339 | 6,756 |  |
| Yorke Peninsula Council | Maitland | 1997 | 5,834 | 2,253 | 11,736 |  |
Southern and Hills Region
This region covers the areas south of Adelaide, including the beautiful Adelaide Hills and coastal towns.
| Local Council | Main Office | Year Started | Land Area | Population (2006 census) | Map | |
|---|---|---|---|---|---|---|
| km² | sq mi | |||||
| Alexandrina Council | Goolwa | 1997 | 1,827 | 705 | 23,160 |  |
| Kangaroo Island Council | Kingscote | 1996 | 4,400 | 1,699 | 4,612 |  |
| District Council of Mount Barker | Mount Barker | 29,864 |  |
|||
| City of Victor Harbor | Victor Harbor | 1975 | 387 | 149 | 13,608 | |
| District Council of Yankalilla | Yankalilla | 1854 | 751 | 290 | 4,577 |  |
Murray Mallee Region
This region follows the Murray River and extends into the Mallee lands.
| Local Council | Main Office | Year Started | Land Area | Population (2006 census) | Map | ||
|---|---|---|---|---|---|---|---|
| km² | sq mi | ||||||
| Berri Barmera Council | Murray Mallee | 1996 | 508 | 196 | 11,240 |  |
|
| The Coorong District Council | Meningie | 1995 | 8,831 | 3,410 | 5,825 |  |
|
| Gerard Community Council | Winkie | 1974 | 86 | 33 | 96 |  |
|
| District Council of Karoonda East Murray | Karoonda | 1979 | 4,415 | 1,705 | 1,193 |  |
|
| District Council of Loxton Waikerie | 1997 | 7,957 | 3,072 | 4,612 |  |
||
| Mid Murray Council | 1997 | 7,957 | 3,072 | 8,511 |  |
||
| Rural City of Murray Bridge | Murray Bridge | 1977 | 7,957 | 3,072 | 19,402 |  |
|
| Renmark Paringa Council | Renmark | 1996 | 916 | 354 | 9,882 |  |
|
| Southern Mallee District Council | Pinnaroo | 6,000 | 2,317 | 2,189 |  |
||
Southeast Region
This region is in the southeast corner of South Australia, known for its forests and volcanic landscapes.
| Local Council | Main Office | Year Started | Land Area | Population (2006 census) | Map | |
|---|---|---|---|---|---|---|
| km² | sq mi | |||||
| District Council of Grant | Mount Gambier | 1996 | 1,904 | 735 | 8,652 |  |
| Kingston District Council | Kingston SE | 1873 | 3,338 | 1,289 | 2,469 |  |
| City of Mount Gambier | Mount Gambier | 308 | 119 | 21,256 |  |
|
| Naracoorte Lucindale Council | Naracoorte | 1993 | 4,517 | 1,744 | 8,489 |  |
| District Council of Robe | Robe | 1869 | 1,091 | 421 | 1,480 |  |
| Tatiara District Council | Bordertown | 1876 | 6,476 | 2,500 | 6,660 |  |
| Wattle Range Council | Millicent | 1997 | 3,924 | 1,515 | 12,554 |  |
Outback
This vast region covers the remote, dry areas of South Australia. It includes some special councils for Aboriginal communities.
| Local Council | Main Office | Year Started | Land Area | Population (2006 census) | Map | |
|---|---|---|---|---|---|---|
| km² | sq mi | |||||
| Anangu Pitjantjatjara Yankunytjatjara | Umuwa | 1981 | 102,650 | 39,633 | 2,230 |  |
| District Council of Coober Pedy | Coober Pedy | 1987 | 78 | 30 | 1,913 |  |
| Maralinga Tjarutja | Ceduna | 2006 | 102,863 | 39,716 | 105 |  |
| Nepabunna Community Council | Nepabunna | 1998 | 76 | 29 | 53 |  |
| Outback Communities Authority | Port Augusta | 1978 | 624,339 | 241,059 | 3,959 | |
| Municipal Council of Roxby Downs | Roxby Downs | 1982 | 110 | 42 | 4,484 |  |
| Yalata Community | 1994 | 4,563 | 1,762 | 100 |  |
|
Images for kids
-
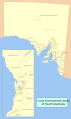
Partial map of LGAs
-
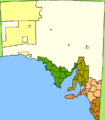
LGA regions
-
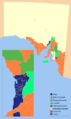
Types of LGAs


