
2017 German federal election facts for kids

The 2017 German federal election was a big vote held in Germany on September 24, 2017. People voted to choose who would represent them in the German parliament, called the Bundestag.
The Christian Democratic Union (CDU) won the most votes, getting 33%. However, both the CDU and the Social Democratic Party (SPD) lost many of their seats in parliament. Two other parties, the Alternative for Germany (AfD) and the Free Democratic Party (FDP), gained a lot of support and entered parliament.
Contents
Political Parties in Germany
Main Parties
These are the main political parties in Germany that won seats in the 2017 election. They are important because they got at least 4% of the national vote.
- Christian Democratic Union (CDU): This party was led by Angela Merkel. It is a center-right party that supports traditional values and is in favor of the European Union. It often works with the Christian Social Union of Bavaria (CSU), which is a similar party mainly in Bavaria.
- Social Democratic Party (SPD): Led by Martin Schulz, this party is center-left. It focuses on social fairness and workers' rights. The SPD also strongly supports the European Union.
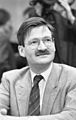
- The Left: This party was led by Sahra Wagenknecht and Dietmar Bartsch. It is a left-wing party that believes in democratic socialism, aiming for more equality and social justice.
- Alliance '90/The Greens: Led by Katrin Göring-Eckardt and Cem Özdemir, this party focuses on environmental protection and social justice. They are also strong supporters of the European Union.
- Free Democratic Party (FDP): This party was led by Christian Lindner. It is a liberal party that believes in individual freedom and a strong market economy. The FDP also supports the European Union.
- Alternative for Germany (AfD): Led by Alice Weidel and Alexander Gauland, this party is right-wing and nationalistic. They are generally against the European Union and have strong views on immigration.
Other Parties
These parties received at least 1% of the national vote in the 2017 election, but did not win enough votes to get seats in parliament.
- Pirate Party Germany: This party focuses on digital rights, privacy, and government transparency.
- National Democratic Party (NDP): This is a far-right party with extreme views.
- Free Voters: This group is not a traditional political party but an association. They often attract conservative voters, especially in southern Germany.
Public Opinion Before the Election
Before the election, many groups asked people who they planned to vote for. This is called an "opinion poll." The image below shows how public opinion changed over time, from the last election in 2013 up to the 2017 election. Each colored line represents a different political party.

Election Results
The 2017 election decided how many seats each party would get in the Bundestag. Here's a summary of the final results:
| Parties | Party list votes | Total seats | |||||
|---|---|---|---|---|---|---|---|
| Votes | % | Change from last election | Seats | Change in seats | % of total seats | ||
| CDU/CSU | 15,317,344 | 32.93% | 246 | 34.7% | |||
| Social Democratic Party | 9,539,381 | 20.51% | 153 | 21.6% | |||
| Alternative for Germany | 5,878,115 | 12.64% | 94 | 13.3% | |||
| Free Democratic Party | 4,999,449 | 10.75% | 80 | 11.3% | |||
| The Left | 4,297,270 | 9.24% | 69 | 9.7% | |||
| Alliance '90/The Greens | 4,158,400 | 8.94% | 67 | 9.4% | |||
| Free Voters | 463,292 | 1.00% | 0 | 0.0% | |||
| Die PARTEI | 454,349 | 0.98% | 0 | 0.0% | |||
| Human Environment Animal Protection | 374,179 | 0.80% | 0 | 0.0% | |||
| National Democratic Party | 176,020 | 0.38% | 0 | 0.0% | |||
| Pirate Party | 173,476 | 0.37% | 0 | 0.0% | |||
| Others | 684,217 | 1.47% | 0 | 0.0% | |||
| Totals | 46,515,492 | 100.0% | 0 | 709 | 0 | 100.0% | |
Voter Turnout
The voter turnout is the percentage of people who were allowed to vote and actually did vote. In the 2017 election, many Germans participated.
| States | Voter turnout |
|---|---|
| 78.3% | |
| 78.2% | |
| 75.6% | |
| 73.7% | |
| 70.7% | |
| 75.9% | |
| 77.0% | |
| 76.4% | |
| 70.9% | |
| 75.4% | |
| 77.6% | |
| 76.6% | |
| 75.4% | |
| 68.1% | |
| 76.5% | |
| 74.3% |
Key Political Leaders
Here are some of the important leaders of the main political parties during the 2017 election:
-
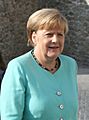
Angela Merkel
Leader of the CDU -

Joachim Herrmann
A leader from the CSU -

Martin Schulz
Leader of the SPD -

Dietmar Bartsch
Co-leader of The Left -

Sahra Wagenknecht
Co-leader of The Left -

Katrin Göring-Eckardt
Co-leader of The Greens -

Cem Özdemir
Co-leader of The Greens -

Christian Lindner
Leader of the FDP -
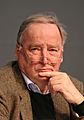
Alexander Gauland
Co-leader of the AfD -

Alice Weidel
Co-leader of the AfD
.jpg)


.jpg)

.jpg)
.jpg)

Images for kids
-
Hermann Otto Solms, a respected member of the 19th Bundestag.

See also
 In Spanish: Elecciones federales de Alemania de 2017 para niños
