Illinois's 13th Senate district facts for kids
Quick facts for kids Illinois's 13thState Senate district |
|||
---|---|---|---|
|
|||
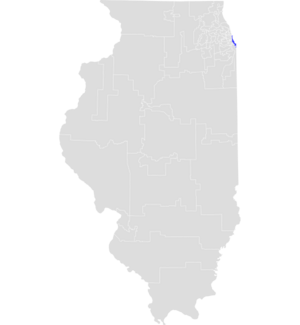
The 13th district since 2023.
|
|||
Senator |
|
||
Demographics | 23.5% White 55.0% Black 12.8% Hispanic 9.0% Asian 1.7% Native American 0.2% Hawaiian/Pacific Islander |
||
Population (2020) • Voting age • Citizens of voting age |
217,228 180,325 153,965 |
Illinois’ 13th Senate district is one of 59 districts in the Illinois Senate. The seat stretches along the southern shoreline of Lake Michigan, from Chicago’s Magnificent Mile to the Indiana border. The seat is home to several Chicago landmarks, including Navy Pier, Millennium Park, Grant Park, the Field Museum of Natural History, the Shedd Aquarium, Soldier Field, the Museum of Science and Industry, and the University of Chicago. Neighborhoods located within its boundaries include Streeterville and the South Side communities of Kenwood, Hyde Park, and South Chicago.
The 13th district is home to 119,000 Black residents, who comprise a majority of the seat’s 217,000 total inhabitants. In recent years, this has made the seat a launching pad for several Black elected officials in Illinois. Notable examples include former President Barack Obama, who springboarded from this seat to the U.S. Senate in 2004, and state Attorney General Kwame Raoul, who represented the district from 2004 to 2019.
Democrats have held this seat with ease for more than six decades. In 2020, Joe Biden (who spent eight years as Obama’s vice president) carried it by an 89%-10% margin over Donald Trump.
Contents
Legislative district history
Prominent legislators
Senators
Senator | Notes |
---|---|
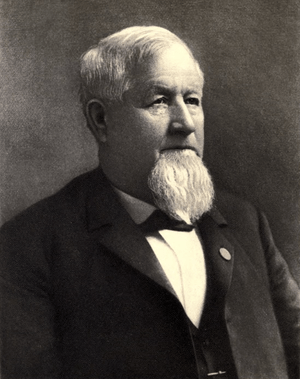
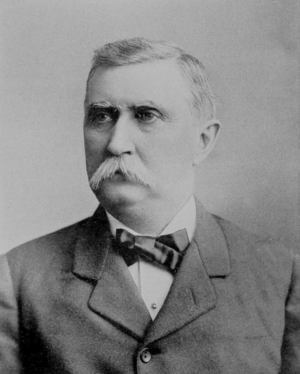
John M. Palmer |
Served as a Major General during the American Civil War (1861–1866) Appointed Military Governor of Kentucky (1865–1866) Elected the 15th Governor of Illinois (1869–1873) Elected to the U.S. Senate from Illinois (1891–1897) National Democratic Party nominee in the 1896 United States presidential election |
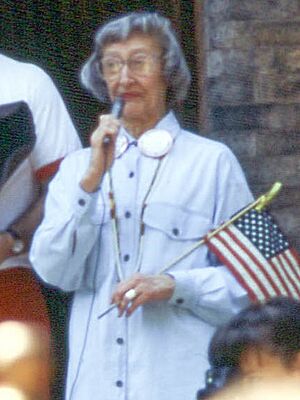
Dawn Clark Netsch |
Elected the 4th Illinois Comptroller (1991–1995) Democratic Party nominee in the 1994 Illinois gubernatorial election |
Richard H. Newhouse Jr. | First African American person to run for Mayor of Chicago in the 1975 Chicago mayoral election |
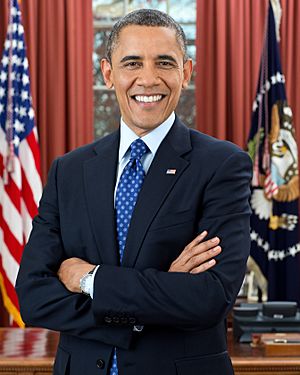
Barack Obama |
Elected to the U.S. Senate from Illinois (2005–2008) Elected the 44th President of the United States (2009–2017) |
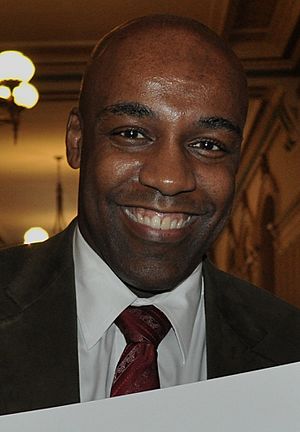
Kwame Raoul |
Elected the 42nd Illinois Attorney General (2019–present) |
Representatives
Representative | Notes |
---|---|
Lyman Beecher Ray |
Elected the 25th Lieutenant Governor of Illinois (1889–1893) |
Seymour Stedman |
Vice-Presidential candidate for the Socialist Party of America during the 1920 United States presidential election |
Gotthard A. Dahlberg |
Served as the 46th Speaker of the Illinois House (1921–1923) |
Stanley H. Kunz |
Elected to the U.S. House of Representatives from Illinois's 8th congressional district (1921–1931) Elected back to the U.S. House of Representatives from Illinois's 8th congressional district (1932–1933) |
James Herbert Wilkerson |
Appointed Judge of the United States District Court for the Northern District of Illinois (1922–1948) |
Elmer Jacob Schnackenberg | Appointed Judge of the United States Court of Appeals for the Seventh Circuit (1953–1968) |
Jesse White |
Served as the 37th Illinois Secretary of State (1999–2023) |
List of senators
1849 – 1871
Senator | Party | Years | General Assembly (GA) | Electoral History | Counties Represented |
---|---|---|---|---|---|
Franklin Witt | Democratic |
January 1, 1849 – ??? |
16th | Elected in 1848 Left the 17th General Assembly at an unknown time. |
Calhoun Greene Jersey Macoupin |
17th | |||||
John M. Palmer |
??? – January 1, 1855 |
Served in the 17th GA Redistricted to the 14th Legislative district and re-elected in 1854. |
|||
18th | |||||
Hugh L. Sutphin | January 1, 1855 – January 3, 1859 |
19th 20th |
Elected in 1854 Was not re-elected in 1858. |
Calhoun Pike Scott |
|
Chauncey L. Higbee |
January 3, 1859 – January 5, 1863 |
21st 22nd |
Elected in 1858 Was not re-elected in 1862. |
||
Bryant T. Schofield | January 5, 1863 – January 7, 1867 |
23rd 24th |
Elected in 1862 Was not re-elected in 1866. |
Adams Hancock |
|
Samuel R. Chittenden | January 7, 1867 – January 4, 1871 |
25th 26th |
Elected in 1866 Was not re-elected in 1870. |
||
Apportionment of 1870 gave the district two senators to elect cumulatively. |
1871 – 1873
Senator | Party | Party Control | Years | General Assembly (GA) | Electoral History | Counties Represented |
---|---|---|---|---|---|---|
Apportionment of 1870 gave the district two senators to elect cumulatively. | ||||||
James H. Richardson | Democratic | 2 Democrats | January 4, 1871 – January 8, 1873 |
27th | Elected in 1870 Was not re-elected in 1872. |
Adams Hancock |
Jesse C. Williams | ||||||
Apportionment of 1872 now gives the district one senator and three representatives to elect. |
1873–present
Senator | Party | Years | General Assembly (GA) | Electoral History | Counties Represented | |
---|---|---|---|---|---|---|
Apportionment of 1872 now gives the district one senator and three representatives to elect. | ||||||
Miles B. Castle | Republican | January 8, 1873 – January 8, 1879 |
28th 29th 30th |
Elected in 1872 Re-elected in 1874 Was not re-elected in 1878. |
DeKalb Grundy Kendall |
|
John R. Marshall | January 8, 1879 – January 3, 1883 |
31st 32nd |
Elected in 1878 Was not re-elected in 1882. |
|||
Millard B. Hereley | Democratic | January 3, 1883 – January 5, 1887 |
33rd 34th |
Elected in 1882 Was not re-elected in 1886. |
Cook | |
Michael F. Garrity | Republican | January 5, 1887 – January 7, 1891 |
35th 36th |
Elected in 1886 Lost re-election in 1890. |
||
John F. O'Malley | Democratic | January 7, 1891 – January 2, 1895 |
37th 38th |
Elected in 1890 Was not re-elected in 1894. |
||
Joseph P. Mahoney | January 2, 1895 – January 7, 1903 |
39th 40th 41st 42nd |
Redistricted from the 5th Legislative district and re-elected in 1894 Re-elected in 1898 Was not re-elected in 1902. |
|||
Albert C. Clark | Republican | January 7, 1903 – January 6, 1915 |
43rd 44th 45th 46th 47th 48th |
Elected in 1902 Re-elected in 1906 Re-elected in 1910 Retired. |
||
John A. Swanson | January 6, 1915 – 1917 |
49th | Elected in 1914 Resigned to become a judge in 1917. |
|||
50th | ||||||
Vacant | 1917 – April 1917 |
|||||
Albert C. Clark | Republican | April 1917 – January 5, 1927 |
50th 51st 52nd 53rd 54th |
Elected back in 1917 special election Re-elected in 1918 Re-elected in 1922 Retired. |
||
Harry W. Starr | January 5, 1927 – January 7, 1931 |
55th 56th |
Elected in 1926 Lost re-election in 1930. |
|||
Francis J. Loughran | Democratic | January 7, 1931 – January 6, 1943 |
57th 58th 59th 60th 61st 62nd |
Elected in 1930 Re-elected in 1934 Re-elected in 1938 Lost re-election in 1942. |
||
Walker Butler | Republican | January 6, 1943 – 1953/1954 |
63rd 64th 65th 66th 67th 68th |
Elected in 1942 Re-elected in 1946 Re-elected in 1950 Resigned after being elected a judge of the Superior Court of Cook County in 1953. |
||
Vacant | 1953/1954 – January 5, 1955 |
68th | ||||
Daniel Dougherty | Democratic | January 5, 1955 – January 4, 1967 |
69th 70th 71st 72nd 73rd 74th |
Elected in 1954 Re-elected in 1958 Re-elected in 1962 Re-districted to the 30th Legislative district and re-elected in 1966. |
||
James P. Loukas | January 4, 1967 – January 13, 1971 |
75th 76th |
Elected in 1966 Retired. |
|||
Ben E. Palmer | January 13, 1971 – January 10, 1973 |
77th | Elected in 1970 Redistricted to the 12th Legislative district and re-elected in 1972. |
|||
Dawn Clark Netsch |
January 10, 1973 – January 12, 1983 |
78th 79th 80th 81st 82nd |
Elected in 1972 Re-elected in 1974 Re-elected in 1978 Redistricted to the 4th Legislative district and re-elected in 1982. |
|||
Richard H. Newhouse Jr. | January 12, 1983 – May 29, 1991 |
83rd 84th 85th 86th 87th |
Redistricted from the 24th Legislative district and re-elected in 1982 Re-elected in 1984 Re-elected in 1988 Resigned in 1991. |
|||
Vacant | May 29, 1991 – June 6, 1991 |
87th | ||||
Alice Palmer | Democratic | June 6, 1991 – January 8, 1997 |
87th 88th 89th |
Appointed in 1991 Elected in 1992 Failed to qualify for nomination and lost renomination in 1996. |
||
Barack Obama |
January 8, 1997 – November 4, 2004 |
90th 91st 92nd 93rd |
Elected in 1996 Re-elected in 1998 Re-elected in 2002 Elected U.S. Senator from Illinois and resigned his state senate seat in 2004. |
|||
Vacant | November 4, 2004 – November 6, 2004 |
93rd | ||||
Kwame Raoul |
Democratic | November 6, 2004 – January 5, 2019 |
93rd 94th 95th 96th 97th 98th 99th 100th |
Appointed in 2004 Elected in 2006 Re-elected in 2010 Re-elected in 2012 Re-elected in 2016 Elected Illinois Attorney General in 2018. |
||
Vacant | January 5, 2019 – January 6, 2019 |
100th | ||||
Robert Peters | Democratic | January 6, 2019 – present |
100th 101st |
Appointed in 2019 Elected in 2020 |
Senator election results
2020 – 2012
Party | Candidate | Votes | % | |
---|---|---|---|---|
Democratic | Robert Peters (incumbent) | 79,024 | 100.0 | |
Total votes | 79,024 | 100.0 |
Party | Candidate | Votes | % | |
---|---|---|---|---|
Democratic | Kwame Raoul (incumbent) | 78,792 | 100.0 | |
Total votes | 78,792 | 100.0 |
Party | Candidate | Votes | % | |
---|---|---|---|---|
Democratic | Kwame Raoul (incumbent) | 74,295 | 100.0 | |
Total votes | 74,295 | 100.0 |
2010 – 2002
2010 Illinois Senate election | |||||
---|---|---|---|---|---|
Party | Candidate | Votes | % | ±% | |
Democratic | Kwame Raoul (incumbent) | 52,254 | 100.0 | +10.37% | |
Total votes | 52,254 | 100.0 |
2006 Illinois Senate election | |||||
---|---|---|---|---|---|
Party | Candidate | Votes | % | ±% | |
Democratic | Kwame Raoul (incumbent) | 49,616 | 89.63 | -10.37 | |
Republican | Charles Kinzer | 5,743 | 10.37 | N/A | |
Total votes | 55,359 | 100.0 |
2002 Illinois Senate election | |||||
---|---|---|---|---|---|
Party | Candidate | Votes | % | ±% | |
Democratic | Barack Obama (incumbent) | 48,717 | 100.0 | +10.83% | |
Total votes | 48,717 | 100.0 |
2000 – 1992
1998 Illinois Senate election | |||||
---|---|---|---|---|---|
Party | Candidate | Votes | % | ±% | |
Democratic | Barack Obama (incumbent) | 45,486 | 89.17 | +7.01% | |
Republican | Yesse B. Yehudah | 5526 | 10.83 | +5.60% | |
Total votes | 51,012 | 100.0 |
1996 Illinois Senate election | |||||
---|---|---|---|---|---|
Party | Candidate | Votes | % | ±% | |
Democratic | Barack Obama | 48,592 | 82.16 | -17.84% | |
Harold Washington | David Whitehead | 7,461 | 12.61 | N/A | |
Republican | Rosette Caldwell Peyton | 3,091 | 5.23 | N/A | |
Total votes | 59,144 | 100.0 |
Party | Candidate | Votes | % | |
---|---|---|---|---|
Democratic | Alice J. Palmer (incumbent) | 69,989 | 100.0 | |
Total votes | 69,989 | 100.0 |
1990 – 1982
Party | Candidate | Votes | % | |
---|---|---|---|---|
Democratic | Richard H. Newhouse Jr. (incumbent) | 64,328 | 100.0 | |
Total votes | 64,328 | 100.0 |
1984 Illinois Senate election | |||||
---|---|---|---|---|---|
Party | Candidate | Votes | % | ±% | |
Democratic | Richard H. Newhouse Jr. (incumbent) | 66,427 | 100.0 | +0.01% | |
Write-in | 3 | 0.00 | -0.01% | ||
Total votes | 66,430 | 100.0 |
1982 Illinois Senate election | |||||
---|---|---|---|---|---|
Party | Candidate | Votes | % | ±% | |
Democratic | Richard H. Newhouse Jr. | 61,158 | 99.99 | +28.62% | |
Write-in | 9 | 0.01 | N/A | ||
Total votes | 61,167 | 100.0 |
1980 – 1972
1978 Illinois Senate election | |||||
---|---|---|---|---|---|
Party | Candidate | Votes | % | ±% | |
Democratic | Dawn Clark Netsch (incumbent) | 33,583 | 71.37 | -7.19% | |
Republican | Robert K. Hall | 13,470 | 28.63 | +7.19% | |
Total votes | 47,053 | 100.0 |
1974 Illinois Senate election | |||||
---|---|---|---|---|---|
Party | Candidate | Votes | % | ±% | |
Democratic | Dawn Clark Netsch (incumbent) | 35,057 | 78.56 | +11.07% | |
Republican | Walter K. Pyle | 9,569 | 21.44 | -10.96% | |
Total votes | 44,626 | 100.0 |
1972 Illinois Senate election | |||||
---|---|---|---|---|---|
Party | Candidate | Votes | % | ±% | |
Democratic | Dawn Clark Netsch | 49,899 | 67.49 | +4.76% | |
Republican | Donald Frank Schroud | 23,954 | 32.40 | -4.87% | |
Write-in | 87 | 0.12 | N/A | ||
Total votes | 73,940 | 100.0 |
1970 – 1962
1970 Illinois Senate election | |||||
---|---|---|---|---|---|
Party | Candidate | Votes | % | ±% | |
Democratic | Ben E. Palmer | 35,554 | 62.73 | +10.20% | |
Republican | Alon Jeffrey | 21,127 | 37.27 | -10.20% | |
Total votes | 56,681 | 100.0 |
1966 Illinois Senate election | |||||
---|---|---|---|---|---|
Party | Candidate | Votes | % | ±% | |
Democratic | James P. Loukas | 35,540 | 52.53 | -9.44% | |
Republican | Irma S. Levin | 32,114 | 47.47 | +9.44% | |
Total votes | 67,654 | 100.0 |
1962 Illinois Senate election | |||||
---|---|---|---|---|---|
Party | Candidate | Votes | % | ±% | |
Democratic | Daniel Dougherty (incumbent) | 20,521 | 61.97 | -14.54% | |
Republican | Edwin W. Smolik | 12,591 | 38.03 | +14.54% | |
Total votes | 33,112 | 100.0 |
1960 – 1952
1958 Illinois Senate election | |||||
---|---|---|---|---|---|
Party | Candidate | Votes | % | ±% | |
Democratic | Daniel Dougherty (incumbent) | 22,679 | 76.51 | +24.50% | |
Republican | Loretta Dunlop | 6,964 | 23.49 | -24.50% | |
Total votes | 29,643 | 100.0 |
1954 Illinois Senate election | |||||
---|---|---|---|---|---|
Party | Candidate | Votes | % | ±% | |
Democratic | Daniel Dougherty | 83,433 | 52.01 | +8.35% | |
Republican | Nicholas J. Bouling | 76,979 | 47.99 | -8.35% | |
Total votes | 160,412 | 100.0 |
1950 – 1942
1950 Illinois Senate election | |||||
---|---|---|---|---|---|
Party | Candidate | Votes | % | ±% | |
Republican | Walker Butler (incumbent) | 102,321 | 56.34 | +0.41% | |
Democratic | Daniel Dougherty | 79,277 | 43.66 | -0.41% | |
Total votes | 181,598 | 100.0 |
1946 Illinois Senate election | |||||
---|---|---|---|---|---|
Party | Candidate | Votes | % | ±% | |
Republican | Walker Butler (incumbent) | 109,098 | 55.93 | +4.74% | |
Democratic | Frank J. (Spike) McAdams | 85,973 | 44.07 | -4.74% | |
Total votes | 195,071 | 100.0 |
1942 Illinois Senate election | |||||
---|---|---|---|---|---|
Party | Candidate | Votes | % | ±% | |
Republican | Walker Butler | 71,568 | 51.19 | +4.04% | |
Democratic | Francis J. Loughran (incumbent) | 68,241 | 48.81 | -4.04% | |
Total votes | 139,809 | 100.0 |
1940 – 1932
1938 Illinois Senate election | |||||
---|---|---|---|---|---|
Party | Candidate | Votes | % | ±% | |
Democratic | Francis J. Loughran (incumbent) | 77,631 | 52.85 | -4.41% | |
Republican | Grenville Beardsley | 69,256 | 47.15 | +5.53% | |
Total votes | 146,887 | 100.0 |
1934 Illinois Senate election | |||||
---|---|---|---|---|---|
Party | Candidate | Votes | % | ±% | |
Democratic | Francis J. Loughran (incumbent) | 65,811 | 57.26 | -0.42% | |
Republican | Grenville Beardsley | 47,841 | 41.62 | -0.59% | |
Independent | H. W. Reed | 900 | 0.78 | N/A | |
Independent | Joseph R. Burda | 384 | 0.33 | N/A | |
Total votes | 114,936 | 100.0 |
1930 – 1922
1930 Illinois Senate election | |||||
---|---|---|---|---|---|
Party | Candidate | Votes | % | ±% | |
Democratic | Francis J. Loughran | 51,158 | 57.68 | +13.48% | |
Republican | Harry W. Starr (incumbent) | 37,437 | 42.21 | -13.36% | |
Independent | John Edward Saff | 94 | 0.11 | N/A | |
Total votes | 88,689 | 100.0 |
1926 Illinois Senate election | |||||
---|---|---|---|---|---|
Party | Candidate | Votes | % | ±% | |
Republican | Harry W. Starr | 36,606 | 55.57 | +2.28% | |
Democratic | John Prystalski | 29,117 | 44.20 | +1.97% | |
Progressive | John C. Flora | 147 | 0.22 | N/A | |
Total votes | 65,870 | 100.0 |
1922 Illinois Senate election | |||||
---|---|---|---|---|---|
Party | Candidate | Votes | % | ±% | |
Republican | Albert C. Clark (incumbent) | 28,544 | 53.29 | +0.10% | |
Democratic | John W. Riley | 22,621 | 42.23 | +1.26% | |
Socialist | George Kohler | 2,403 | 4.49 | -1.36% | |
Total votes | 53,568 | 100.0 |
1920 – 1912
1918 Illinois Senate election | |||||
---|---|---|---|---|---|
Party | Candidate | Votes | % | ±% | |
Republican | Albert C. Clark (incumbent) | 15,827 | 53.19 | +11.80% | |
Democratic | James J. Mulcahey | 12,191 | 40.97 | +5.53% | |
Socialist | Zephiere Pepin | 1,740 | 5.85 | -3.99% | |
Total votes | 29,758 | 100.0 |
1914 Illinois Senate election | |||||
---|---|---|---|---|---|
Party | Candidate | Votes | % | ±% | |
Republican | John A. Swanson | 9,555 | 41.39 | -1.01% | |
Democratic | John W. Riley | 8,183 | 35.44 | -3.75% | |
Progressive | Cecil C. Erickson | 3,078 | 13.33 | N/A | |
Socialist | Charles V. Johnson | 2,271 | 9.84 | +0.47% | |
Total votes | 23,087 | 100.0 |
1910 – 1902
1910 Illinois Senate election | |||||
---|---|---|---|---|---|
Party | Candidate | Votes | % | ±% | |
Republican | Albert C. Clark (incumbent) | 9,358 | 42.40 | -6.88% | |
Democratic | James Kirby | 8,649 | 39.19 | +14.75% | |
Socialist | Nels Anderson | 2,069 | 9.37 | -3.44% | |
Independent Republican | Frank E. Paulson | 1,537 | 6.96 | N/A | |
Prohibition | Perry Kim | 458 | 2.08 | N/A | |
Total votes | 22,071 | 100.0 |
1906 Illinois Senate election | |||||
---|---|---|---|---|---|
Party | Candidate | Votes | % | ±% | |
Republican | Albert C. Clark (incumbent) | 9,123 | 49.28 | -2.88% | |
Democratic | William H. Suffield | 4,525 | 24.44 | -9.21% | |
Socialist | Matt Whalen | 2,372 | 12.81 | +1.01% | |
Independence | Frank E. Campbell | 2,170 | 11.72 | N/A | |
Independent | John C. Grantham | 324 | 1.75 | N/A | |
Total votes | 18,514 | 100.0 |
1902 Illinois Senate election | |||||
---|---|---|---|---|---|
Party | Candidate | Votes | % | ±% | |
Republican | Albert C. Clark | 8,996 | 52.16 | N/A | |
Democratic | W. R. Bowes | 5,803 | 33.65 | -13.55% | |
Socialist | T. J. Vind | 2,036 | 11.80 | N/A | |
Prohibition | Robert Johns | 321 | 1.86 | N/A | |
Single Tax | John M. Bryen | 91 | 0.53 | N/A | |
Total votes | 17,247 | 100.0 |
1900 – 1892
Party | Candidate | Votes | % | |
---|---|---|---|---|
Democratic | Joseph P. Mahoney | 5,873 | 47.20 | |
Unknown | William J. Cooke | 5771 | 46.38 | |
Unknown | John Pecha | 798 | 6.41 | |
Total votes | 12,442 | 100.0 |
1890 – 1882
Party | Candidate | Votes | % | |
---|---|---|---|---|
Unknown | Michael F. Garrity | 2,296 | 38.27 | |
Democratic | John F. O'Malley | 2,086 | 34.77 | |
Unknown | M. Lucie | 1617 | 26.95 | |
Total votes | 5,999 | 100.0 |
Party | Candidate | Votes | % | |
---|---|---|---|---|
Unknown | Millard B. Hereley | 3,514 | 58.44 | |
Unknown | Peter Kiolbassa | 2416 | 40.18 | |
Unknown | John Fossell | 83 | 1.38 | |
Total votes | 6,013 | 100.0 |
1880 – 1872
Party | Candidate | Votes | % | |
---|---|---|---|---|
Unknown | John R. Marshall | 5,088 | 56.70 | |
Unknown | Chauncey Ellwood | 3883 | 43.27 | |
Unknown | —— Wells | 2 | 0.02 | |
Total votes | 8,973 | 100.0 |
Historical list of representatives
1873 – 1957
Representative | Party | Party Control | Years | General Assembly (GA) | Electoral History | Counties Represented | |
---|---|---|---|---|---|---|---|
Apportionment of 1872 now gives the district one senator and three representatives to elect. | |||||||
Perry A. Armstrong |
Democratic | 2 Republicans 1 Democrat |
January 8, 1873 – January 6, 1875 |
28th | Elected in 1872 Was not re-elected in 1874. |
DeKalb Grundy Kendall |
|
George M. Hollenback | Republican | ||||||
Lyman Beecher Ray |
|||||||
D. B. Bailey | 2 Independents 1 Republican |
January 6, 1875 – January 3, 1877 |
29th | Elected in 1874 Was not re-elected in 1876. |
|||
Philip Collins | Independent | ||||||
Joshua McGrath | |||||||
William M. Byers | Republican | 2 Republicans 1 Democrat |
January 3, 1877 – January 5, 1881 |
30th 31st |
Elected in 1876 Re-elected in 1878 Was not re-elected in 1880. |
||
Amos D. Clover | Democratic | January 3, 1877 – January 8, 1879 |
30th | Elected in 1876 Was not re-elected in 1878. |
|||
Peter S. Lott | Republican | ||||||
Robert M. Brigham | 2 Republicans 1 Greenback |
January 8, 1879 – January 5, 1881 |
31st | Elected in 1878 Was not re-elected in 1880. |
|||
Alonzo B. Smith | Greenback | ||||||
John C. Clark | Democratic | 2 Republicans 1 Democrat |
January 5, 1881 – January 3, 1883 |
32nd | Served during the 32nd GA Was not re-elected in 1882. |
||
Hiram Loucks | Republican | ||||||
Henry Wood | Served during the 32nd GA Redistricted to the 17th Legislative district and re-elected in 1882. |
||||||
Benton F. Kleeman | Unknown | Unknown | Served during the 32nd GA Was not re-elected in 1882. |
||||
John F. Dugan | Democratic | 2 Democrats 1 Republican |
January 3, 1883 – January 7, 1885 |
33rd | Elected in 1882 Was not re-elected in 1884. |
Cook | |
Gregory A. Klupp | Elected in 1882 Lost re-election. |
||||||
Peter Sundelius | Republican | January 3, 1883 – January 5, 1887 |
33rd 34th |
Elected in 1882 Re-elected in 1884 Was not re-elected in 1886. |
|||
Barney Brachtendorf | Democratic | January 7, 1885 – January 5, 1887 |
34th | Elected in 1884 Lost re-election. |
|||
Thomas F. Mulheran | Elected in 1884 Was not re-elected in 1886. |
||||||
Victor Carlowski | Socialist | 1 Democrat 1 Republican 1 Socialist |
January 5, 1887 – January 9, 1889 |
35th | Elected in 1886 Was not re-elected in 1888. |
||
J. J. Furlong | Democratic | ||||||
Frank E. Schoenwald | Republican | ||||||
Stanley H. Kunz |
Democratic | 2 Democrats 1 Republican |
January 9, 1889 – January 7, 1891 |
36th | Elected in 1888 Was not re-elected in 1890. |
||
William H. Lyman | January 9, 1889 – January 4, 1893 |
36th 37th |
Elected in 1888 Re-elected in 1890 |
||||
Peter Sundelius | Republican | January 9, 1889 – January 7, 1891 |
36th | Elected back in 1888 Was not re-elected in 1890. |
|||
Samuel E. Erickson | January 7, 1891 – January 4, 1893 |
37th | Elected in 1890 | ||||
John A. Kwasigroch | Democratic | ||||||
Samuel E. Erickson | Republican | January 4, 1893 – January 9, 1895 |
38th | Re-elected in 1892 Was not re-elected in 1894. |
|||
John A. Kwasigroch | Democratic | ||||||
William H. Lyman | Re-elected in 1892 Redistricted to the 23rd Legislative district and re-elected in 1894. |
||||||
James P. Cavanagh | Republican | January 9, 1895 – January 7, 1903 |
39th 40th 41st 42nd |
Elected in 1894 Re-elected in 1896 Re-elected in 1898 Re-elected in 1900 Redistricted to the 15th Legislative district and re-elected in 1902. |
|||
Edward J. Novak | Democratic | January 9, 1895 – January 4, 1899 |
39th 40th |
Redistricted from the 5th Legislative district and re-elected in 1894 Re-elected in 1896 Was not re-elected in 1898. |
|||
Simon Shaffer | January 9, 1895 – January 6, 1897 |
39th | Elected in 1894 Lost re-election in 1896. |
||||
William Carmody | January 6, 1897 – January 7, 1903 |
40th 41st 42nd |
Elected in 1896 Re-elected in 1898 Re-elected in 1900 Was not re-elected in 1902. |
||||
John Churan | January 4, 1899 – January 9, 1901 |
41st | Elected in 1898 Was not re-elected in 1900. |
||||
Cyril R. Jandus | January 9, 1901 – January 7, 1903 |
42nd | Elected in 1900 Elected state Senator from the 15th Legislative district in 1902. |
||||
Henry V. Meeteren | 2 Republicans 1 Democrat |
January 7, 1903 – January 4, 1905 |
43rd | Elected in 1902 Was not re-elected in 1904. |
|||
Benton F. Kleeman | Republican | January 7, 1903 – January 9, 1907 |
43rd 44th |
Elected in 1902 Re-elected in 1904 Was not re-elected in 1906. |
|||
James Herbert Wilkerson |
January 7, 1903 – January 4, 1905 |
43rd | Elected in 1902 Was not re-elected in 1904. |
||||
William T. Monroe | January 4, 1905 – January 9, 1907 |
44th | Elected in 1904 Was not re-elected in 1906. |
||||
John J. Poulton | Democratic | January 4, 1905 – January 4, 1911 |
44th 45th 46th |
Elected in 1904 Re-elected in 1906 Re-elected in 1908 Was not re-elected in 1910. |
|||
Edward C. Fitch | Republican | January 9, 1907 – January 6, 1909 |
45th | Elected in 1906 Was not re-elected in 1908. |
|||
Cornelius J. Ton | January 9, 1907 – January 4, 1911 |
45th 46th |
Elected in 1906 Re-elected in 1908 Was not re-elected in 1910. |
||||
Benton F. Kleeman | January 6, 1909 – January 6, 1915 |
46th 47th 48th |
Elected back in 1908 Re-elected in 1910 Re-elected in 1912 Was not re-elected in 1914. |
||||
John A. Swanson | January 4, 1911 – January 8, 1913 |
47th | Elected in 1910 Lost re-election in 1912. |
||||
Timothy Dunne | Democratic | ||||||
Elmer Jacob Schnackenberg | Progressive | 1 Progressive 1 Republican 1 Socialist |
January 8, 1913 – January 6, 1915 |
48th | Elected in 1912 Was not re-elected in 1914. |
||
Seymour Stedman |
Socialist | ||||||
James W. Ryan | Democratic | 2 Republicans 1 Democrat |
January 6, 1915 – January 3, 1923 |
49th 50th 51st 52nd |
Elected in 1914 Re-elected in 1916 Re-elected in 1918 Re-elected in 1920 Was not re-elected in 1922. |
||
Gotthard A. Dahlberg |
Republican | January 6, 1915 – January 7, 1925 |
49th 50th 51st 52nd 53rd |
Elected in 1914 Re-elected in 1916 Re-elected in 1918 Re-elected in 1920 Re-elected in 1922 Was not re-elected in 1924. |
|||
C. A. Young | January 6, 1915 – January 3, 1923 |
49th 50th 51st 52nd |
Elected in 1914 Re-elected in 1916 Re-elected in 1918 Re-elected in 1920 Lost renomination in 1922. |
||||
William W. Powers | Democratic | January 3, 1923 – January 4, 1939 |
53rd 54th 55th 56th 57th 58th 59th 60th |
Elected in 1922 Re-elected in 1924 Re-elected in 1926 Re-elected in 1928 Re-elected in 1930 Re-elected in 1932 Re-elected in 1934 Re-elected in 1936 Retired. |
|||
Elmer Jacob Schnackenberg | Republican | January 3, 1923 – January 3, 1945 |
53rd 54th 55th 56th 57th 58th 59th 60th 61st 62nd 63rd |
Elected back in 1922 Re-elected in 1924 Re-elected in 1926 Re-elected in 1928 Re-elected in 1930 Re-elected in 1932 Re-elected in 1934 Re-elected in 1936 Re-elected in 1938 Re-elected in 1940 Re-elected in 1942 Retired. |
|||
Theo D. Smith | January 7, 1925 – January 5, 1927 |
54th | Elected in 1924 Lost re-election in 1926. |
||||
John C. Garriott, Jr. | Democratic | 2 Democrats 1 Republican |
January 5, 1927 – January 4, 1933 |
55th | Elected in 1926 Re-elected in 1928 Re-elected in 1930 Retired. |
||
Republican | 2 Republicans 1 Democrat |
56th 57th |
|||||
John G. Ryan | Democratic | 2 Democrats 1 Republican |
January 4, 1933 – January 9, 1957 |
58th 59th 60th 61st 62nd 63rd 64th 65th 66th 67th 68th 69th |
Elected in 1932 Re-elected in 1934 Re-elected in 1936 Re-elected in 1938 Re-elected in 1940 Re-elected in 1942 Re-elected in 1944 Re-elected in 1946 Re-elected in 1948 Re-elected in 1950 Re-elected in 1952 Re-elected in 1954 Redistricted to the 25th Representative district and re-elected in 1956. |
||
Adam S. Mioduski | January 4, 1939 – January 6, 1943 |
61st 62nd |
Elected in 1938 Re-elected in 1940 Lost re-election. |
||||
Ragnar G. Nelson | Republican | 2 Republicans 1 Democrat |
January 6, 1943 – January 5, 1949 |
63rd 64th 65th |
Elected in 1942 Re-elected in 1944 Re-elected in 1946 Lost re-election. |
||
Adam S. Mioduski | Democratic | 2 Democrats 1 Republican |
January 3, 1945 – January 8, 1947 |
64th | Elected back in 1944 Lost re-election. |
||
Edward Schneider | Republican | 2 Republicans 1 Democrat |
January 8, 1947 – January 9, 1957 |
65th 66th 67th 68th 69th |
Elected in 1946 Re-elected in 1948 Re-elected in 1950 Re-elected in 1952 Re-elected in 1954 Redistricted to the 25th Representative district and re-elected in 1956. |
||
Adam S. Mioduski | Democratic | 2 Democrats 1 Republican |
January 5, 1949 – January 3, 1951 |
66th | Elected back in 1948 Lost re-election. |
||
Marie H. Suthers | Republican | 2 Republicans 1 Democrat |
January 3, 1951 – January 7, 1953 |
67th | Elected in 1950 Lost re-election. |
||
Henry M. Lenard | Democratic | 2 Democrats 1 Republican |
January 7, 1953 – January 9, 1957 |
68th 69th |
Elected in 1952 Re-elected in 1954 Redistricted to the 24th Representative district and re-elected in 1956. |
||
Representative districts re-established in 1957 |
1973 – 1983
Representative | Party | Party Control | Years | General Assembly (GA) | Electoral History | Counties Represented |
---|---|---|---|---|---|---|
Apportionment of 1971 reallocates three representatives to Legislative districts. | ||||||
James Houlihan | Democratic | 2 Democrats 1 Republican |
January 10, 1973 – January 10, 1979 |
78th 79th 80th |
Elected in 1972 Re-elected in 1974 Re-elected in 1976 Lost renomination in 1978. |
Cook |
Robert L. Thompson | January 10, 1973 – January 8, 1975 |
78th | Redistricted from the 12th Representative district and re-elected in 1972 Retired. |
|||
Paul J. Randolph | Republican | January 10, 1973 – January 12, 1977 |
78th 79th |
Redistricted from the 12th Representative district and re-elected in 1972 Re-elected in 1974 Retired. |
||
Jesse White |
Democratic | January 8, 1975 – January 12, 1983 |
79th | Elected in 1974 Retired. |
||
Daniel P. O'Brien | January 12, 1977 – January 12, 1983 |
80th 81st 82nd |
Elected in 1976 Re-elected in 1978 Re-elected in 1980 Retired. |
|||
Elroy C. Sandquist, Jr. | Republican | Elected in 1976 Re-elected in 1978 Re-elected in 1980 Redistricted to the 8th Representative district and lost re-election. |
||||
Jesse White |
Democratic | January 10, 1979 – January 12, 1983 |
81st 82nd |
Elected back in 1978 Re-elected in 1980 Redistricted to the 8th Representative district and won re-election. |
||
Representative districts re-established with approval of the Cutback Amendment. |
Representative election results
1980 – 1972
Party | Candidate | Votes | % | |
---|---|---|---|---|
Democratic | Daniel P. O'Brien (incumbent) | 68,802 | 35.14 | |
Democratic | Jesse C. White, Jr. (incumbent) | 53,603 | 27.38 | |
Republican | Elroy C. Sandquist, Jr. (incumbent) | 41,877.5 | 21.39 | |
Republican | Raymond H. Schumacher | 24,408.5 | 12.47 | |
Libertarian | Jim Peron | 3,498.5 | 1.79 | |
Libertarian | Celeste M. Webb | 1,940.5 | 0.99 | |
Libertarian | William W. Hall | 1,663.5 | 0.85 | |
Write-in | 7 | 0.00 | ||
Total votes | 195,800.5 | 100.0 |
Party | Candidate | Votes | % | |
---|---|---|---|---|
Democratic | Daniel P. O'Brien (incumbent) | 45,721 | 34.00 | |
Democratic | Jesse C. White, Jr. | 38,905.5 | 28.93 | |
Republican | Elroy C. Sandquist, Jr. (incumbent) | 33,933 | 25.24 | |
Republican | Raymond H. Schumacher | 15,894.5 | 11.82 | |
Write-in | 11 | 0.01 | ||
Total votes | 134,465 | 100.0 |
Party | Candidate | Votes | % | |
---|---|---|---|---|
Democratic | Jesse C. White, Jr. | 27,612 | 35.01 | |
Democratic | Daniel P. O'Brien (incumbent) | 25,291 | 32.07 | |
Democratic | James M. Houlihan (incumbent) | 20,112 | 25.50 | |
Democratic | Gary Nepon | 5,859 | 7.43 | |
Total votes | 78,874 | 100.0 |
Party | Candidate | Votes | % | |
---|---|---|---|---|
Democratic | Daniel P. O'Brien | 62,032.5 | 30.27 | |
Democratic | James M. Houlihan (incumbent) | 54,444 | 26.57 | |
Republican | Elroy C. Sandquist, Jr. | 46,127 | 22.51 | |
Republican | Tom (Thomas E.) McNamara | 42,306.5 | 20.65 | |
Write-in | 2 | 0.00 | ||
Total votes | 204,912 | 100.0 |
Party | Candidate | Votes | % | |
---|---|---|---|---|
Democratic | James M. Houlihan (incumbent) | 53,844 | 41.41 | |
Democratic | Jesse C. White, Jr. | 34,851 | 26.80 | |
Republican | Paul J. Randolph (incumbent) | 22,702.5 | 17.46 | |
Republican | Tom McNamara | 18,625 | 14.32 | |
Total votes | 130,022.5 | 100.0 |
Party | Candidate | Votes | % | |
---|---|---|---|---|
Democratic | James M. Houlihan | 90,286.5 | 42.77 | |
Democratic | Robert L. Thompson | 44,528 | 21.09 | |
Republican | Paul J. Randolph | 43,624 | 20.67 | |
Republican | Hawley H. Stodder | 32,641.5 | 15.46 | |
Write-in | 4 | 0.00 | ||
Total votes | 211,084 | 100.0 |
1954 – 1952
Party | Candidate | Votes | % | |
---|---|---|---|---|
Democratic | John G. Ryan (incumbent) | 135,139.5 | 28.52 | |
Democratic | Henry M. Lenard (incumbent) | 131,948 | 27.85 | |
Republican | Edward Schneider (incumbent) | 102,382.5 | 21.61 | |
Republican | Armand Chiappori | 101,217 | 21.36 | |
Independent | Kelly J. Laphen | 3,124 | 0.66 | |
Total votes | 473,811 | 100.0 |
Party | Candidate | Votes | % | |
---|---|---|---|---|
Democratic | Henry M. Lenard | 168,245 | 25.55 | |
Republican | Edward Schneider (incumbent) | 167,407 | 25.42 | |
Democratic | John G. Ryan (incumbent) | 162,324 | 24.65 | |
Republican | Marie H. Suthers (incumbent) | 160,633.5 | 24.39 | |
Total votes | 658,609.5 | 100.0 |
1950 – 1942
Party | Candidate | Votes | % | |
---|---|---|---|---|
Republican | Edward Schneider (incumbent) | 150,566.5 | 27.93 | |
Republican | Marie H. Suthers | 140,173.5 | 26.01 | |
Democratic | John G. Ryan (incumbent) | 125,660.5 | 23.31 | |
Democratic | Adam S. Mioduski (incumbent) | 122,572 | 22.74 | |
Total votes | 538,972.5 | 100.0 |
Party | Candidate | Votes | % | |
---|---|---|---|---|
Democratic | John G. Ryan (incumbent) | 167,205.5 | 27.58 | |
Democratic | Adam S. Mioduski | 163,419 | 26.96 | |
Republican | Edward Schneider (incumbent) | 141,459.5 | 23.34 | |
Republican | Ragnar G. Nelson (incumbent) | 134,103.5 | 22.12 | |
Total votes | 606,187.5 | 100.0 |
Party | Candidate | Votes | % | |
---|---|---|---|---|
Republican | Edward Schneider | 161,232 | 27.74 | |
Republican | Ragnar G. Nelson (incumbent) | 159,401.5 | 27.42 | |
Democratic | John G. Ryan (incumbent) | 130,728.5 | 22.49 | |
Democratic | Adam S. Mioduski (incumbent) | 129,881 | 22.35 | |
Total votes | 581,243 | 100.0 |
Party | Candidate | Votes | % | |
---|---|---|---|---|
Democratic | Adam S. Mioduski | 164,413.5 | 27.59 | |
Democratic | John G. Ryan (incumbent) | 155,764 | 26.14 | |
Republican | Ragnar G. Nelson (incumbent) | 139,373.5 | 23.39 | |
Republican | Edward Schneider | 136,358 | 22.88 | |
Total votes | 595,909 | 100.0 |
Party | Candidate | Votes | % | |
---|---|---|---|---|
Republican | Elmer J. Schnackenberg (incumbent) | 115,920.5 | 27.55 | |
Democratic | John G. Ryan (incumbent) | 105,735 | 25.13 | |
Republican | Ragnar G. Nelson | 100,437 | 23.87 | |
Democratic | Adam S. Mioduski (incumbent) | 98,719 | 23.46 | |
Write-in | 1 | 0.00 | ||
Total votes | 420,812.5 | 100.0 |
1940 – 1932
Party | Candidate | Votes | % | |
---|---|---|---|---|
Republican | Elmer J. Schnackenberg (incumbent) | 155,191.5 | 27.40 | |
Democratic | John G. Ryan (incumbent) | 151,743.5 | 26.79 | |
Democratic | Adam S. Mioduski (incumbent) | 134,495.5 | 23.75 | |
Republican | Ragnar G. Nelson | 124,948.5 | 22.06 | |
Total votes | 566,379 | 100.0 |
Party | Candidate | Votes | % | |
---|---|---|---|---|
Democratic | John G. Ryan (incumbent) | 121,001 | 27.22 | |
Republican | Elmer J. Schnackenberg (incumbent) | 118,093.5 | 26.56 | |
Democratic | Adam S. Mioduski | 112,508 | 25.31 | |
Republican | William C. Henry | 92,949 | 20.91 | |
Total votes | 444,551.5 | 100.0 |
Party | Candidate | Votes | % | |
---|---|---|---|---|
Democratic | William W. Powers (incumbent) | 153,786 | 29.03 | |
Democratic | John G. Ryan (incumbent) | 148,613 | 28.06 | |
Republican | Elmer J. Schnackenberg (incumbent) | 120,688 | 22.79 | |
Republican | George R. Hillstrom | 106,492.5 | 20.11 | |
Write-in | 1 | 0.00 | ||
Total votes | 529,580.5 | 100.0 |
Party | Candidate | Votes | % | |
---|---|---|---|---|
Republican | Elmer J. Schnackenberg (incumbent) | 132,668 | 40.17 | |
Democratic | William W. Powers (incumbent) | 100,816.5 | 30.52 | |
Democratic | John G. Ryan (incumbent) | 91,936 | 27.83 | |
Independent | George A. Meade | 1,856.5 | 0.56 | |
Independent | Edgar D. Cressy | 1,100 | 0.33 | |
Independent | Charles V. Johnson | 1,037.5 | 0.31 | |
Independent | Victor Murray | 888.5 | 0.27 | |
Total votes | 330,303 | 100.0 |
Party | Candidate | Votes | % | |
---|---|---|---|---|
Republican | Elmer J. Schnackenberg (incumbent) | 115,826 | 27.33 | |
Democratic | William W. Powers (incumbent) | 112,629 | 26.58 | |
Democratic | John G. Ryan | 102,434 | 24.17 | |
Republican | John R. Hillstrom | 92,921 | 21.92 | |
Write-in | 3 | 0.00 | ||
Total votes | 423,813 | 100.0 |
1930 – 1922
Party | Candidate | Votes | % | |
---|---|---|---|---|
Democratic | William W. Powers (incumbent) | 131,733.5 | 52.29 | |
Republican | Elmer J. Schnackenberg (incumbent) | 68,079.5 | 27.03 | |
Republican | John C. Garriott, Jr. (incumbent) | 50,777 | 20.16 | |
Independent | George J. Avery | 1,004.5 | 0.40 | |
Independent | Frank Hoskins | 315 | 0.13 | |
Total votes | 251,909.5 | 100.0 |
Party | Candidate | Votes | % | |
---|---|---|---|---|
Democratic | William W. Powers (incumbent) | 146,977 | 42.34 | |
Republican | John C. Garriott, Jr. (incumbent) | 103,704 | 29.88 | |
Republican | Elmer J. Schnackenberg (incumbent) | 96,439.5 | 27.78 | |
Total votes | 347,120.5 | 100.0 |
Party | Candidate | Votes | % | |
---|---|---|---|---|
Democratic | William W. Powers (incumbent) | 71,929.5 | 37.11 | |
Republican | Elmer J. Schnackenberg (incumbent) | 45,735.5 | 23.60 | |
Democratic | John C. Garriott, Jr. | 39,099.5 | 20.17 | |
Republican | Theo D. Smith (incumbent) | 36,657.5 | 18.91 | |
Progressive | Chas. F. Lowrie | 399.5 | 0.21 | |
Total votes | 193,821.5 | 100.0 |
Party | Candidate | Votes | % | |
---|---|---|---|---|
Republican | Elmer J. Schnackenberg (incumbent) | 80,927 | 37.16 | |
Republican | Theo D. Smith | 74,913.5 | 34.40 | |
Democratic | William W. Powers (incumbent) | 59,473.5 | 27.31 | |
Socialist | Harry O. Forsberg | 2,461 | 1.13 | |
Total votes | 217,775 | 100.0 |
Party | Candidate | Votes | % | |
---|---|---|---|---|
Democratic | William W. Powers | 57,403.5 | 40.86 | |
Republican | Gotthard A. Dahlberg (incumbent) | 41,819.5 | 29.77 | |
Republican | Elmer J. Schnackenberg | 35,231 | 25.08 | |
Socialist | Harold O. Forsberg | 6,042.5 | 4.30 | |
Total votes | 140,496.5 | 100.0 |
Party | Candidate | Votes | % | |
---|---|---|---|---|
Republican | Gotthard A. Dahlberg (incumbent) | 18,896 | 36.23 | |
Republican | Elmer J. Schnackenberg | 15,670 | 30.05 | |
Republican | C. A. Young (incumbent) | 13,826.5 | 26.51 | |
Republican | W. C. Thomas | 3,756 | 7.20 | |
Total votes | 52,148.5 | 100.0 |
1920 – 1912
Party | Candidate | Votes | % | |
---|---|---|---|---|
Republican | Gotthard A. Dahlberg (incumbent) | 59,644.5 | 35.16 | |
Republican | C. A. Young (incumbent) | 56,390 | 33.25 | |
Democratic | James W. Ryan (incumbent) | 43,915 | 25.89 | |
Socialist | Harold O. Forsberg | 9,668.5 | 5.70 | |
Total votes | 169,618 | 100.0 |
Party | Candidate | Votes | % | |
---|---|---|---|---|
Democratic | James W. Ryan (incumbent) | 34,206 | 40.66 | |
Republican | C. A. Young (incumbent) | 24,350 | 28.94 | |
Republican | Gotthard A. Dahlberg (incumbent) | 21,009 | 24.97 | |
Socialist | Joseph A. Gajeski | 4,571.5 | 5.43 | |
Total votes | 84,136.5 | 100.0 |
Party | Candidate | Votes | % | |
---|---|---|---|---|
Democratic | James W. Ryan (incumbent) | 37,364 | 35.39 | |
Republican | Gotthard A. Dahlberg (incumbent) | 28,905 | 27.38 | |
Republican | C. A. Young (incumbent) | 26,422 | 25.03 | |
Socialist | Theodore J. Vind | 12,888.5 | 12.21 | |
Total votes | 105,579.5 | 100.0 |
Party | Candidate | Votes | % | |
---|---|---|---|---|
Democratic | James W. Ryan | 21,867 | 32.80 | |
Republican | Gotthard A. Dahlberg | 13,832 | 20.75 | |
Republican | C. A. Young | 12,008.5 | 18.01 | |
Progressive | Elmer J. Schnackenberg (incumbent) | 10,086.5 | 15.13 | |
Socialist | Seymour Stedman (incumbent) | 8,878.5 | 13.32 | |
Total votes | 66,672.5 | 100.0 |
Party | Candidate | Votes | % | |
---|---|---|---|---|
Progressive | Elmer J. Schnackenberg | 20,260 | 23.81 | |
Socialist | Seymour Stedman | 13,051.5 | 15.34 | |
Republican | Benton F. Kleeman (incumbent) | 10,257.5 | 12.06 | |
Republican | John A. Swanson (incumbent) | 10,022.5 | 11.78 | |
Democratic | Timothy Dunne (incumbent) | 9,362.5 | 11.00 | |
Democratic | John W. Riley | 9,033.5 | 10.62 | |
Democratic | Fred C. Lockwood | 8,937 | 10.50 | |
Independent | Albert C. Moses | 3,779.5 | 4.44 | |
Prohibition | Chas. H. Doolittle | 375.5 | 0.44 | |
Total votes | 85,079.5 | 100.0 |
1910 – 1902
Party | Candidate | Votes | % | |
---|---|---|---|---|
Republican | John A. Swanson | 15,383 | 23.94 | |
Republican | Benton F. Kleeman (incumbent) | 14,248.5 | 22.18 | |
Democratic | Timothy Dunne | 14,054 | 21.87 | |
Democratic | James J. Mulcahey | 13,277 | 20.66 | |
Socialist | Bernard Berlyn | 5,570.5 | 8.67 | |
Prohibition | George A. Cressey | 1,720 | 2.68 | |
Write-in | 1.5 | 0.00 | ||
Total votes | 64,254.5 | 100.0 |
Party | Candidate | Votes | % | |
---|---|---|---|---|
Democratic | John J. Poulton (incumbent) | 22,720 | 31.06 | |
Republican | Benton F. Kleeman | 20,527 | 28.06 | |
Republican | Cornelius J. Ton (incumbent) | 19,899.5 | 27.20 | |
Socialist | Harold J. LeCren | 4,426.5 | 6.05 | |
Prohibition | G. A. Dahlberg | 3,902.5 | 5.33 | |
Independent | Warren McIntire | 1,680 | 2.30 | |
Total votes | 73,155.5 | 100.0 |
Party | Candidate | Votes | % | |
---|---|---|---|---|
Democratic | John J. Poulton (incumbent) | 14,293.5 | 26.22 | |
Republican | Cornelius J. Ton | 13,416 | 24.61 | |
Republican | Edward C. Fitch | 12,806.5 | 23.49 | |
Socialist | Theodore J. Vind | 7,377 | 13.53 | |
Independence | Charles J. Phillips | 5,792.5 | 10.63 | |
Independent | Otis A. Corner | 828.5 | 1.52 | |
Total votes | 54,514 | 100.0 |
Party | Candidate | Votes | % | |
---|---|---|---|---|
Republican | William T. Monroe | 18,182.5 | 26.29 | |
Republican | Benton F. Kleeman (incumbent) | 18,003.5 | 26.03 | |
Democratic | John J. Poulton | 17,185 | 24.85 | |
Socialist | T. J. Vind | 11,549.5 | 16.70 | |
Prohibition | Eric Sandell | 4,236.5 | 6.13 | |
Total votes | 69,157 | 100.0 |
Party | Candidate | Votes | % | |
---|---|---|---|---|
Democratic | Henry V. Meeteren | 15,497 | 30.71 | |
Republican | Benton F. Kleeman | 13,412 | 26.58 | |
Republican | James H. Wilkerson | 12,441.5 | 24.66 | |
Socialist | Seymour Steadman | 5,780.5 | 11.46 | |
Independent | Oscar Wolf | 1,574.5 | 3.12 | |
Prohibition | Frederick D. Peters | 767 | 1.52 | |
Independent Democrat | John Gohring | 557.5 | 1.10 | |
Single Tax | Amosa E. Conrow | 331.5 | 0.66 | |
Independent Republican | Luloff Wilson | 93.5 | 0.19 | |
Total votes | 50,455 | 100.0 |
1900 – 1892
Party | Candidate | Votes | % | |
---|---|---|---|---|
Republican | James P. Cavanagh (incumbent) | 11,046.5 | 30.41 | |
Democratic | John Churan | 9,707.5 | 26.73 | |
Democratic | William Carmody (incumbent) | 8,350.5 | 22.99 | |
Unknown | Simon Shaffer | 4394 | 12.10 | |
Unknown | James Kozisek | 1597 | 4.40 | |
Unknown | Philip Rosenberg | 679 | 1.87 | |
Unknown | A. Woloshem | 545 | 1.50 | |
Total votes | 36,319.5 | 100.0 |
Party | Candidate | Votes | % | |
---|---|---|---|---|
Republican | James P. Cavanaugh (incumbent) | 15,328 | 34.63 | |
Democratic | Edward J. Novak (incumbent) | 10,890 | 24.60 | |
Democratic | William Carmody | 7,420 | 16.76 | |
Democratic | Simon Shaeffer (incumbent) | 6,897 | 15.58 | |
Unknown | Michael E. Clare | 1243 | 2.81 | |
Unknown | James Kozisek | 1111 | 2.51 | |
Unknown | Harry Goldstine | 715 | 1.62 | |
Unknown | Isaac Levin | 523 | 1.18 | |
Unknown | Niles Johnson | 139 | 0.31 | |
Total votes | 44,266 | 100.0 |
1890 – 1882
Party | Candidate | Votes | % | |
---|---|---|---|---|
Unknown | Frank E. Schoenewald | 4,991.5 | 28.22 | |
Unknown | Victor Karlowski | 4,968 | 28.08 | |
Unknown | J. J. Furlong | 4,531.5 | 25.62 | |
Unknown | Barney Brachtendorf (incumbent) | 3045 | 17.21 | |
Unknown | A. J. Kerr | 124 | 0.70 | |
Unknown | John Miller | 30 | 0.17 | |
Total votes | 17,690 | 100.0 |
Party | Candidate | Votes | % | |
---|---|---|---|---|
Unknown | Barney Brachtendorf | 5,912.5 | 22.57 | |
Unknown | Peter A. Sundelius (incumbent) | 5,736.5 | 21.90 | |
Unknown | Thomas F. Mulhearn | 5,230.5 | 19.96 | |
Unknown | Gregory A. Klupp (incumbent) | 5174 | 19.75 | |
Unknown | Patrick T. Pendergast | 2447 | 9.34 | |
Unknown | Christopher Dahnke | 1606 | 6.13 | |
Unknown | Geo. Vogel | 93 | 0.35 | |
Total votes | 26,199.5 | 100.0 |
Party | Candidate | Votes | % | |
---|---|---|---|---|
Unknown | John F. Dugan | 4,972 | 28.49 | |
Unknown | George A. Klupp | 4,807 | 27.55 | |
Unknown | Peter Sundelius | 4,104 | 23.52 | |
Unknown | B. Janssens | 2506.5 | 14.36 | |
Unknown | Lars P. Nelson | 1060 | 6.07 | |
Total votes | 17,449.5 | 100.0 |