John Day, Oregon facts for kids
Quick facts for kids
John Day, Oregon
|
|
|---|---|
 |
|
Location in Oregon
|
|
| Country | United States |
| State | Oregon |
| County | Grant |
| Incorporated | 1901 |
| Area | |
| • Total | 2.26 sq mi (5.85 km2) |
| • Land | 2.26 sq mi (5.85 km2) |
| • Water | 0.00 sq mi (0.00 km2) |
| Elevation | 3,078 ft (938 m) |
| Population
(2020)
|
|
| • Total | 1,664 |
| • Density | 736.3/sq mi (284.4/km2) |
| Time zone | UTC-8 (Pacific) |
| • Summer (DST) | UTC-7 (Pacific) |
| ZIP code |
97845
|
| Area code(s) | 458 and 541 |
| FIPS code | 41-37550 |
| GNIS feature ID | 2410144 |
| Website | www.cityofjohnday.com |
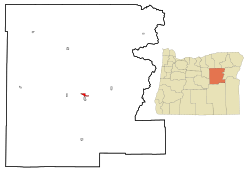
John Day is a city in Grant County, Oregon, United States. It's about 2 miles (3.2 km) north of Canyon City. The city is named after the nearby John Day River. This river, and also Dayville, were named for John Day. He was a member of the 1811 Astor Expedition. John Day became an official city in 1901.
In 2020, the city had a population of 1,664 people. This makes it the largest city in Grant County.
Contents
History of John Day
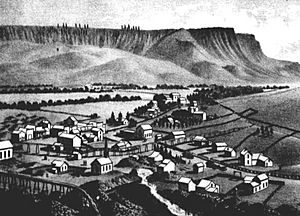
The first piece of land claimed in what is now Grant County was in 1862. This happened within the area that is now John Day. At first, John Day didn't grow as fast as its neighbor, Canyon City. Canyon City was the main town and a busy mining center.
However, over time, people and businesses started moving to John Day. This often happened after big fires in Canyon City. For example, the courthouse burned in 1870. Chinatown in Canyon City burned in 1885. Other fires in 1898 and 1937 also badly damaged Canyon City's downtown.
The first post office in "John Day City" opened in 1865. It closed in 1871 but reopened in 1879 as John Day. In 1900, local leaders decided to make John Day an official city. The state of Oregon approved this on February 23, 1901.
A large part of early John Day was its Chinese community. This area was often called Tiger Town. In 1882, a local church had 547 members, and 382 of them were Chinese. By 1887, nearly 1,000 Chinese immigrants lived in John Day. They had come to the area because of a gold rush about 20 years earlier. Many also moved after the 1885 fire in Canyon City.
In the 1860s, a trading post was built in the area. In 1887, two Chinese immigrants, Lung On and Ing Hay, bought it. They turned it into a clinic, a general store, and a social spot. This place stayed open until the 1940s. Later, in the 1970s, the city of John Day made it a museum. It's called the Kam Wah Chung & Co. Museum. Today, it's a great example of a Chinese medicine shop from the 1800s. It became a special National Historic Landmark in 2005.
Geography of John Day
John Day covers about 1.87 square miles (4.84 km2) of land. There is no water area within the city limits.
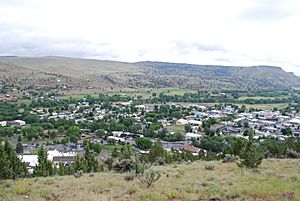
The city is surrounded by mountains. The Strawberry Mountains are to the south. The Blue Mountains are to the east.
What is the geology of John Day?
The rocks under John Day are very old. They include metamorphic and igneous rocks from the Permian and Triassic periods. These rocks became part of North America a very long time ago. Later, during the Cenozoic Era, volcanic rocks were laid down on top. These are linked to the large Columbia River Basalt flows.
The area around John Day is famous for its paleontological resources. This means it has many important fossils. From when the dinosaurs disappeared until the Ice Age, volcanoes and other natural events helped preserve these fossils. Scientists can accurately date these fossils. This helps them study how living things changed over time. It also shows how ecosystems and climate were connected in the past.
What is the climate like in John Day?
John Day has an oceanic climate, even though it's dry and inland. This means it has mild temperatures. However, it's also quite dry, almost like a steppe climate. Its cold winters also make it similar to a humid continental climate.
| Climate data for John Day, Oregon (1991–2020 normals, extremes 1903–1906, 1953–present) | |||||||||||||
|---|---|---|---|---|---|---|---|---|---|---|---|---|---|
| Month | Jan | Feb | Mar | Apr | May | Jun | Jul | Aug | Sep | Oct | Nov | Dec | Year |
| Record high °F (°C) | 69 (21) |
73 (23) |
80 (27) |
91 (33) |
98 (37) |
103 (39) |
110 (43) |
112 (44) |
110 (43) |
95 (35) |
79 (26) |
66 (19) |
112 (44) |
| Mean daily maximum °F (°C) | 40.3 (4.6) |
44.8 (7.1) |
51.5 (10.8) |
57.3 (14.1) |
66.4 (19.1) |
74.5 (23.6) |
86.2 (30.1) |
85.8 (29.9) |
76.7 (24.8) |
62.2 (16.8) |
47.5 (8.6) |
39.0 (3.9) |
61.0 (16.1) |
| Daily mean °F (°C) | 30.8 (−0.7) |
33.7 (0.9) |
38.9 (3.8) |
43.8 (6.6) |
51.8 (11.0) |
58.6 (14.8) |
67.0 (19.4) |
65.9 (18.8) |
57.9 (14.4) |
46.7 (8.2) |
36.6 (2.6) |
29.9 (−1.2) |
46.8 (8.2) |
| Mean daily minimum °F (°C) | 21.2 (−6.0) |
22.6 (−5.2) |
26.4 (−3.1) |
30.3 (−0.9) |
37.1 (2.8) |
42.7 (5.9) |
47.8 (8.8) |
46.1 (7.8) |
39.1 (3.9) |
31.1 (−0.5) |
25.6 (−3.6) |
20.8 (−6.2) |
32.6 (0.3) |
| Record low °F (°C) | −24 (−31) |
−20 (−29) |
−5 (−21) |
13 (−11) |
13 (−11) |
25 (−4) |
35 (2) |
30 (−1) |
21 (−6) |
4 (−16) |
−9 (−23) |
−23 (−31) |
−24 (−31) |
| Average precipitation inches (mm) | 1.09 (28) |
0.60 (15) |
1.14 (29) |
1.49 (38) |
1.83 (46) |
1.30 (33) |
0.43 (11) |
0.50 (13) |
0.52 (13) |
1.04 (26) |
1.19 (30) |
1.14 (29) |
12.27 (312) |
| Average snowfall inches (cm) | 3.5 (8.9) |
1.4 (3.6) |
1.2 (3.0) |
0.3 (0.76) |
0.0 (0.0) |
0.0 (0.0) |
0.0 (0.0) |
0.0 (0.0) |
0.0 (0.0) |
0.2 (0.51) |
1.0 (2.5) |
2.0 (5.1) |
9.6 (24) |
| Average precipitation days (≥ 0.01 in) | 10.6 | 8.7 | 10.4 | 11.9 | 12.0 | 8.5 | 3.3 | 3.1 | 4.4 | 8.2 | 10.6 | 11.3 | 103.0 |
| Average snowy days (≥ 0.1 in) | 3.0 | 1.8 | 1.2 | 0.6 | 0.0 | 0.0 | 0.0 | 0.0 | 0.0 | 0.1 | 1.2 | 2.7 | 10.6 |
| Source: NOAA | |||||||||||||
Population of John Day
| Historical population | |||
|---|---|---|---|
| Census | Pop. | %± | |
| 1870 | 179 | — | |
| 1880 | 280 | 56.4% | |
| 1890 | 211 | −24.6% | |
| 1900 | 282 | 33.6% | |
| 1910 | 258 | −8.5% | |
| 1920 | 321 | 24.4% | |
| 1930 | 432 | 34.6% | |
| 1940 | 708 | 63.9% | |
| 1950 | 1,597 | 125.6% | |
| 1960 | 1,520 | −4.8% | |
| 1970 | 1,566 | 3.0% | |
| 1980 | 2,012 | 28.5% | |
| 1990 | 1,836 | −8.7% | |
| 2000 | 1,821 | −0.8% | |
| 2010 | 1,744 | −4.2% | |
| 2020 | 1,664 | −4.6% | |
| source: | |||
John Day population in 2010
In 2010, there were 1,744 people living in John Day. There were 794 households and 450 families. The city had about 932.6 inhabitants per square mile (360.1/km2) people per square mile. There were 895 housing units.
Most residents (94.4%) were White. Other groups included African American (0.5%), Native American (1.5%), and Asian (0.7%). About 2.7% of the population was Hispanic or Latino.
About 26.8% of households had children under 18. Many households (41.4%) were married couples. The average household had 2.13 people. The average family had 2.79 people.
The average age in John Day was 42.9 years. About 22.2% of residents were under 18. About 22% were 65 or older. The population was 47.6% male and 52.4% female.
Economy of John Day
For a long time, John Day's economy depended on industries like gold mining, sheep and cattle farming, and logging. However, things have changed. Gold mining stopped in the U.S. in 1942. It became harder to find ponderosa pine trees for logging. Also, transportation costs were high. These reasons made resource-based jobs less common.
Now, many jobs in John Day are in other areas. These include recreation, health care, and government work. The main office for the Malheur National Forest is in John Day. These types of jobs now make up most of the work in the city.
Transportation in John Day
- Grant County Regional Airport
- U.S. Route 26 and U.S. Route 395 are major roads.
See also
 In Spanish: John Day (Oregón) para niños
 | DeHart Hubbard |
 | Wilma Rudolph |
 | Jesse Owens |
 | Jackie Joyner-Kersee |
 | Major Taylor |


