List of French departments by population facts for kids
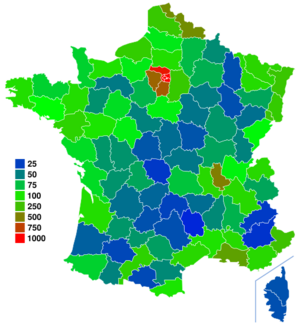
France is divided into areas called departments. Think of them like states or large counties. There are 101 of them, and each one has its own unique features and number of people living there. This article helps you understand how many people live in each French department, how big the departments are, and how crowded they are. We'll look at the departments from the most populated to the least.
Understanding the Numbers
When we talk about the population of a department, we're looking at how many people officially live there. These numbers are collected by the French government to help understand how communities are growing and changing.
- The numbers include the official population counts from different years, like 1999, 2008, and 2019.
- "Municipal population" is the official number of people living in a department, including everyone who has their main home there.
- These counts make sure that people aren't counted twice, even if they have more than one home.
How Populations Have Changed
Between 1999 and 2006, most French departments actually grew in population. This means more people moved in or were born there than moved out or passed away.
However, a few departments saw their populations shrink:
- Allier and Cantal in the Auvergne region.
- Creuse in the Limousin region.
- Ardennes and Haute-Marne in the Champagne-Ardenne region.
- Nièvre in Burgundy.
- Vosges in Lorraine.
On the other hand, some departments grew a lot! The departments that gained the most people were:
- Haute-Garonne
- Gironde
- Bouches-du-Rhône
- Seine-Saint-Denis
- Loire-Atlantique
- Hauts-de-Seine
- Hérault
You might notice that Guadeloupe, an overseas department, seemed to lose population between 1999 and 2008. But this wasn't because people left. Instead, two parts of Guadeloupe became their own separate areas: Saint Barthélemy and Saint Martin. If you look at just the original area of Guadeloupe, its population actually grew by more than 15,000 people during that time!
Departments by Population Size
This table shows some of the French departments, ranked by how many people lived there in 2019. It also shows their population in earlier years, their total area, and their population density.
- Rank: Where the department stands from most to least populated.
- Department: The name of the department.
- Legal population: The official number of people living there in different years (1931, 1999, 2008, 2019).
- Area (km²): How big the department is in square kilometers.
- Pop. density (Pop./km²): This tells you how crowded a department is. It's the number of people living in each square kilometer. A higher number means more people are packed into a smaller space.
- INSEE Dept. No.: A special code number for each department, used by the French government.
Here are some of the departments, from the most populated to the least:
| 2019 Rank | Department | Legal population in 1999 | Legal population in 2019 | Area (km²) | Pop. density (Pop./km²) | INSEE Dept. No. |
|---|---|---|---|---|---|---|
| 1 | Nord | 2,555,020 | 2,608,346 | 5,743 | 454 | 59 |
| 2 | Paris | 2,125,246 | 2,165,423 | 105 | 20,545 | 75 |
| 3 | Bouches-du-Rhône | 1,835,719 | 2,043,110 | 5,087 | 402 | 13 |
| 4 | Rhône | 1,578,869 | 1,875,747 | 2,715 | 171 | 69D |
| 5 | Seine-Saint-Denis | 1,382,861 | 1,644,903 | 236 | 6,964 | 93 |
| 6 | Hauts-de-Seine | 1,428,881 | 1,624,357 | 176 | 9,250 | 92 |
| 7 | Gironde | 1,287,334 | 1,623,749 | 10,725 | 163 | 33 |
| 8 | Pas-de-Calais | 1,441,568 | 1,465,278 | 6,671 | 220 | 62 |
| 9 | Yvelines | 1,354,308 | 1,448,207 | 2,284 | 634 | 78 |
| 10 | Loire-Atlantique | 1,134,266 | 1,429,272 | 6,815 | 208 | 44 |
| 11 | Seine-et-Marne | 1,193,767 | 1,421,197 | 5,915 | 240 | 77 |
| 12 | Lyon Metropolis | - | 1,411,571 | 534 | 2,645 | 69M |
| 13 | Val-de-Marne | 1,227,250 | 1,407,124 | 245 | 5,743 | 94 |
| 14 | Haute-Garonne | 1,046,338 | 1,400,039 | 6,309 | 222 | 31 |
| 15 | Essonne | 1,134,238 | 1,301,659 | 1,804 | 721 | 91 |
| 97 | Ariège | 137,205 | 153,287 | 4,890 | 31 | 09 |
| 98 | Cantal | 150,778 | 144,692 | 5,726 | 25 | 15 |
| 99 | Territoire de Belfort | 137,408 | 141,318 | 609 | 232 | 90 |
| 100 | Hautes-Alpes | 121,419 | 141,220 | 5,549 | 26 | 05 |
| 101 | Creuse | 124,470 | 116,617 | 5,565 | 21 | 23 |
| 102 | Lozère | 73,509 | 76,604 | 5,167 | 15 | 48 |
 | Percy Lavon Julian |
 | Katherine Johnson |
 | George Washington Carver |
 | Annie Easley |


