
Mason County, Illinois facts for kids
Quick facts for kids
Mason County
|
|
|---|---|

Mason County Courthouse, Havana
|
|

Location within the U.S. state of Illinois
|
|
 Illinois's location within the U.S. |
|
| Country | |
| State | |
| Founded | 1841 |
| Named for | George Mason |
| Seat | Havana |
| Largest city | Havana |
| Area | |
| • Total | 563 sq mi (1,460 km2) |
| • Land | 539 sq mi (1,400 km2) |
| • Water | 24 sq mi (60 km2) 4.3% |
| Population
(2020)
|
|
| • Total | 13,086 |
| • Estimate
(2021)
|
12,881 |
| • Density | 23.243/sq mi (8.974/km2) |
| Time zone | UTC−6 (Central) |
| • Summer (DST) | UTC−5 (CDT) |
| Congressional district | 15th |
Mason County is a special area in the state of Illinois, USA. It's like a big neighborhood with its own local government. In 2020, about 13,086 people lived here. The main town, or "county seat," where the county government is located, is Havana. The county is named after George Mason, who was an important person in Virginia. He helped create the United States Bill of Rights, which protects many of our freedoms.
Contents
History of Mason County
Mason County was created in 1841. It was formed from parts of two other counties: Tazewell and Menard counties.
-
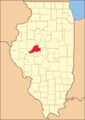
Mason County when it was first created in 1841

Geography and Nature
Mason County covers about 563 square miles. Most of this area, about 539 square miles, is land. The remaining 24 square miles (which is about 4.3%) is water.
The Sangamon River forms the southern border of Mason County. The Illinois River is on its western side. These two rivers meet at the very southwest tip of the county.
Much of Mason County has very sandy soil. This sand was left behind about 10,000 years ago. This happened when a huge ice sheet, called the Wisconsin Glacier, melted. The melting water carried a lot of sand. It dropped this sand in a delta area where the Sangamon and Illinois Rivers meet.
Sandy soil doesn't hold water very well. This can make it hard for crops to grow if there isn't much rain. However, this soil is great for growing certain vegetables that aren't common in other parts of Illinois. Today, farmers use modern irrigation systems to water their crops. This makes Mason County a very productive farming area.
There's a special sandy wetland along the Illinois River. It's managed by the U.S. Fish and Wildlife Service. This area is called the Chautauqua National Wildlife Refuge. It helps protect many different kinds of animals and plants.
Protected Natural Areas
- Chautauqua National Wildlife Refuge (part of it is in Mason County)
State Forests
- Sand Ridge State Forest is the largest state forest in Illinois. It covers about 7,200 acres (2,900 hectares).
State Fish & Wildlife Areas
- Sanganois State Fish & Wildlife Area (part of it is in Mason County)
Climate and Weather
| Weather chart for Havana, Illinois | |||||||||||||||||||||||||||||||||||||||||||||||
|---|---|---|---|---|---|---|---|---|---|---|---|---|---|---|---|---|---|---|---|---|---|---|---|---|---|---|---|---|---|---|---|---|---|---|---|---|---|---|---|---|---|---|---|---|---|---|---|
| J | F | M | A | M | J | J | A | S | O | N | D | ||||||||||||||||||||||||||||||||||||
|
1.9
32
14
|
1.9
38
19
|
3
50
30
|
3.5
63
40
|
4.4
74
51
|
3.8
84
60
|
3.9
88
64
|
3.5
86
61
|
3.2
80
52
|
2.9
68
41
|
3.3
51
30
|
2.6
37
19
|
||||||||||||||||||||||||||||||||||||
| temperatures in °F precipitation totals in inches source: The Weather Channel |
|||||||||||||||||||||||||||||||||||||||||||||||
|
Metric conversion
|
|||||||||||||||||||||||||||||||||||||||||||||||
In Havana, the county seat, temperatures change throughout the year. In January, the average low is about 14°F ( -10°C). In July, the average high is about 88°F (31°C). The coldest temperature ever recorded was -30°F (-34°C) in January 1999. The hottest was 106°F (41°C) in July 1983. The county usually gets the most rain in May, about 4.43 inches (11.25 cm). January is usually the driest month, with about 1.85 inches (4.7 cm) of rain.
Neighboring Counties
- Fulton County - to the northwest
- Tazewell County - to the northeast
- Logan County - to the southeast
- Menard County - to the south
- Cass County - to the southwest
- Schuyler County - to the west
Transportation and Roads
Public Transportation
- SHOW Bus offers public transportation services.
Main Highways
 U.S. Highway 136
 Illinois Route 10
 Illinois Route 29
 Illinois Route 78
 Illinois Route 97
 Illinois Route 100
Population and People
| Historical population | |||
|---|---|---|---|
| Census | Pop. | %± | |
| 1850 | 5,921 | — | |
| 1860 | 10,931 | 84.6% | |
| 1870 | 16,184 | 48.1% | |
| 1880 | 16,242 | 0.4% | |
| 1890 | 16,067 | −1.1% | |
| 1900 | 17,491 | 8.9% | |
| 1910 | 17,377 | −0.7% | |
| 1920 | 16,634 | −4.3% | |
| 1930 | 15,115 | −9.1% | |
| 1940 | 15,358 | 1.6% | |
| 1950 | 15,326 | −0.2% | |
| 1960 | 15,193 | −0.9% | |
| 1970 | 16,161 | 6.4% | |
| 1980 | 19,492 | 20.6% | |
| 1990 | 16,269 | −16.5% | |
| 2000 | 16,038 | −1.4% | |
| 2010 | 14,666 | −8.6% | |
| 2020 | 13,086 | −10.8% | |
| 2023 (est.) | 12,523 | −14.6% | |
| U.S. Decennial Census 1790-1960 1900-1990 1990-2000 2010-2013 |
|||
In 2010, there were 14,666 people living in Mason County. Most people (98.1%) were white. A small number were Black or African American (0.4%), Asian (0.3%), or American Indian (0.2%). About 0.8% of the population was of Hispanic or Latino origin. Many families in the county have German, American, English, or Irish backgrounds.
About 28.9% of homes had children under 18 living there. The average age of people in Mason County was 44 years old.
Towns and Villages
Cities
- Havana (This is the county seat)
- Mason City
Villages
Special Designated Place
- Goofy Ridge is a census-designated place. This means it's an area identified by the Census Bureau for statistics, but it's not an official city or village.
Other Small Communities
Townships
- Allens Grove
- Bath
- Crane Creek
- Forest City
- Havana
- Kilbourne
- Lynchburg
- Manito
- Mason City
- Pennsylvania
- Quiver
- Salt Creek
- Sherman
Education in Mason County
Here are the school districts that serve students from kindergarten through 12th grade:
- Havana Community Unit School District 126
- Illini Central Community Unit School District 189
- Midwest Central Community Unit School District 191
Mason County also includes parts of these school districts:
- New Holland-Middletown Elementary School District 88 (for elementary students)
- Lincoln Community High School District 404 (for high school students)
See also
 In Spanish: Condado de Mason (Illinois) para niños
