Priest River, Idaho facts for kids
Quick facts for kids
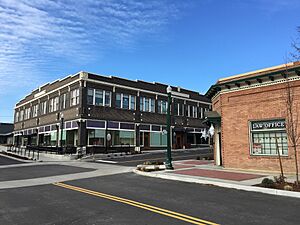
Priest River, Idaho
|
|
|---|---|
 |
|
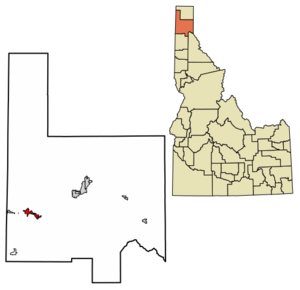
Location of Priest River in Bonner County, Idaho.
|
|
| Country | United States |
| State | Idaho |
| County | Bonner |
| Area | |
| • Total | 3.70 sq mi (9.58 km2) |
| • Land | 3.55 sq mi (9.20 km2) |
| • Water | 0.14 sq mi (0.37 km2) |
| Elevation | 2,139 ft (652 m) |
| Population
(2010)
|
|
| • Total | 1,751 |
| • Estimate
(2019)
|
1,893 |
| • Density | 532.64/sq mi (205.67/km2) |
| Time zone | UTC-8 (Pacific (PST)) |
| • Summer (DST) | UTC-7 (PDT) |
| ZIP code |
83856
|
| Area code(s) | 208, 986 |
| FIPS code | 16-65530 |
| GNIS feature ID | 0397069 |
Priest River is a city located in Bonner County, Idaho. It is in the northern part of the state, known as the Idaho Panhandle. The city is found where the Priest River flows into the larger Pend Oreille River.
In 2020, about 1,696 people lived in Priest River. In 2010, the population was 1,751.
Contents
City Location and Rivers
Priest River is located at 48°11′0″N 116°54′34″W / 48.18333°N 116.90944°W. It sits about 2,139 feet (652 m) above sea level. This means it's 2,139 feet higher than the ocean.
The city covers a total area of about 3.84 square miles (9.95 km2). Most of this area is land, with a small part being water.
Priest River is on the west side of the Priest River. This river starts at Priest Lake, which is about 68 miles north. The Priest River then joins the much bigger Pend Oreille River.
Roads and Nearby Areas
U.S. Route 2 goes through Priest River. This highway connects the city to Sandpoint in the east and Newport in the state of Washington to the west.
Priest River is only about 7 miles (11 km) east of the border with Washington. It is also less than 60 miles (100 km) south of the Canadian border, specifically British Columbia.
Local Climate
Priest River has a climate known as a warm-summer mediterranean climate. This type of climate has warm, dry summers and mild, wet winters.
The hottest temperature ever recorded in Priest River was 108 °F (42.2 °C). This happened on June 29, 2021. The coldest temperature ever recorded was −36 °F (−37.8 °C) on December 30, 1968.
| Climate data for Priest River, Idaho, 1991–2020 normals, extremes 1898–present | |||||||||||||
|---|---|---|---|---|---|---|---|---|---|---|---|---|---|
| Month | Jan | Feb | Mar | Apr | May | Jun | Jul | Aug | Sep | Oct | Nov | Dec | Year |
| Record high °F (°C) | 52 (11) |
57 (14) |
73 (23) |
88 (31) |
97 (36) |
108 (42) |
105 (41) |
105 (41) |
97 (36) |
83 (28) |
64 (18) |
57 (14) |
108 (42) |
| Mean maximum °F (°C) | 43.2 (6.2) |
47.0 (8.3) |
60.3 (15.7) |
74.0 (23.3) |
84.0 (28.9) |
88.7 (31.5) |
94.8 (34.9) |
95.0 (35.0) |
86.4 (30.2) |
70.7 (21.5) |
51.6 (10.9) |
42.6 (5.9) |
96.6 (35.9) |
| Mean daily maximum °F (°C) | 31.8 (−0.1) |
36.8 (2.7) |
46.1 (7.8) |
56.7 (13.7) |
67.9 (19.9) |
73.5 (23.1) |
83.2 (28.4) |
82.9 (28.3) |
71.9 (22.2) |
54.0 (12.2) |
38.4 (3.6) |
30.9 (−0.6) |
56.2 (13.4) |
| Daily mean °F (°C) | 26.9 (−2.8) |
29.4 (−1.4) |
36.3 (2.4) |
44.0 (6.7) |
53.3 (11.8) |
58.9 (14.9) |
65.4 (18.6) |
64.3 (17.9) |
55.5 (13.1) |
43.1 (6.2) |
32.7 (0.4) |
26.5 (−3.1) |
44.7 (7.1) |
| Mean daily minimum °F (°C) | 22.1 (−5.5) |
22.0 (−5.6) |
26.4 (−3.1) |
31.2 (−0.4) |
38.8 (3.8) |
44.2 (6.8) |
47.6 (8.7) |
45.8 (7.7) |
39.0 (3.9) |
32.0 (0.0) |
27.1 (−2.7) |
22.1 (−5.5) |
33.2 (0.7) |
| Mean minimum °F (°C) | −0.2 (−17.9) |
2.7 (−16.3) |
11.0 (−11.7) |
21.5 (−5.8) |
26.5 (−3.1) |
33.5 (0.8) |
37.5 (3.1) |
35.1 (1.7) |
26.5 (−3.1) |
17.4 (−8.1) |
10.1 (−12.2) |
2.8 (−16.2) |
−8.0 (−22.2) |
| Record low °F (°C) | −33 (−36) |
−35 (−37) |
−18 (−28) |
−1 (−18) |
18 (−8) |
24 (−4) |
29 (−2) |
26 (−3) |
16 (−9) |
−5 (−21) |
−12 (−24) |
−36 (−38) |
−36 (−38) |
| Average precipitation inches (mm) | 3.95 (100) |
2.59 (66) |
3.40 (86) |
2.50 (64) |
2.76 (70) |
2.61 (66) |
0.97 (25) |
0.87 (22) |
1.30 (33) |
2.89 (73) |
4.19 (106) |
4.53 (115) |
32.56 (826) |
| Average snowfall inches (cm) | 21.8 (55) |
11.3 (29) |
5.4 (14) |
0.3 (0.76) |
0.0 (0.0) |
0.0 (0.0) |
0.0 (0.0) |
0.0 (0.0) |
0.0 (0.0) |
0.2 (0.51) |
9.2 (23) |
25.7 (65) |
73.9 (187.27) |
| Average extreme snow depth inches (cm) | 22.1 (56) |
21.1 (54) |
17.5 (44) |
2.7 (6.9) |
0.0 (0.0) |
0.0 (0.0) |
0.0 (0.0) |
0.0 (0.0) |
0.0 (0.0) |
6.1 (15) |
16.0 (41) |
22.1 (56) |
25.3 (64) |
| Average precipitation days (≥ 0.01 in) | 16.4 | 12.2 | 13.7 | 13.0 | 12.3 | 11.9 | 5.6 | 5.3 | 7.0 | 12.0 | 15.6 | 16.5 | 141.5 |
| Average snowy days (≥ 0.1 in) | 10.6 | 6.4 | 3.6 | 0.3 | 0.0 | 0.0 | 0.0 | 0.0 | 0.0 | 0.1 | 4.7 | 11.8 | 37.5 |
| Source 1: NOAA | |||||||||||||
| Source 2: National Weather Service | |||||||||||||
Main Highways
 - US 2 - This highway goes to Sandpoint (northeast) and Spokane, Washington (southwest).
 - SH-57 - This highway leads north to Priest Lake.
Population Information
| Historical population | |||
|---|---|---|---|
| Census | Pop. | %± | |
| 1910 | 248 | — | |
| 1920 | 545 | 119.8% | |
| 1930 | 949 | 74.1% | |
| 1940 | 1,056 | 11.3% | |
| 1950 | 1,592 | 50.8% | |
| 1960 | 1,749 | 9.9% | |
| 1970 | 1,493 | −14.6% | |
| 1980 | 1,639 | 9.8% | |
| 1990 | 1,560 | −4.8% | |
| 2000 | 1,754 | 12.4% | |
| 2010 | 1,751 | −0.2% | |
| 2019 (est.) | 1,893 | 8.1% | |
| U.S. Decennial Census | |||
Population in 2010
In 2010, the city of Priest River had 1,751 people living there. There were 713 households, which means 713 homes or groups of people living together.
About 34.5% of these households had children under 18 years old. The average household had about 2.45 people.
The average age of people in Priest River was 38.1 years old. About 26.7% of the residents were under 18. Also, 15.8% of the people were 65 years old or older.
The population was almost evenly split between males and females. About 49.2% were male and 50.8% were female.
See also
 In Spanish: Priest River para niños
 | Audre Lorde |
 | John Berry Meachum |
 | Ferdinand Lee Barnett |

