
Ultimate tensile strength facts for kids

Ultimate tensile strength (often called UTS or tensile strength) is a measure of how much a material can be stretched or pulled before it breaks. Think of it as the material's maximum strength when being pulled apart.
This strength is usually found by doing a special test called a tensile test. During this test, a machine pulls on a sample of the material. It measures how much force is needed to stretch the material and how much it stretches. The highest point on the graph of this pulling force versus how much it stretches is the ultimate tensile strength.
Materials that break suddenly, like glass, are called brittle materials. For these, the ultimate tensile strength is very close to when they first start to give way. But materials that can stretch a lot before breaking, like rubber or many metals, are called ductile materials. These can often handle much more pulling force before they finally snap.
Knowing the ultimate tensile strength is important for designing things, especially with brittle materials. Engineers use these numbers to make sure that parts won't break when they are pulled or stretched.
Contents
What is Ultimate Tensile Strength?
The ultimate tensile strength of a material is a special property. It means that its value does not change, no matter how big or small the piece of material is. For example, a small piece of steel has the same ultimate tensile strength as a large beam of the same steel.
However, this strength can depend on other things. These include how the material was made, if it has any tiny scratches on its surface, or even the temperature when it's being tested.
Some materials break very sharply. They don't change their shape much before snapping. This is called a brittle failure. Other materials, like most metals, are more ductile. This means they will stretch and change shape a lot before they finally break. Sometimes, they even get thinner in one spot, like a rubber band before it snaps. This thinning is called necking.
Tensile strength is measured as a stress. Stress is like how much force is spread out over an area. Imagine pushing on a small spot versus pushing on a large area; the small spot feels more pressure.
In the science world, the main unit for stress is the pascal (Pa). Often, we use megapascals (MPa), which is a million pascals. In some countries, like the United States, people might use pounds per square inch (psi) or kilopounds per square inch (ksi). These are just different ways to measure the same thing: force spread over an area.
Ductile Materials and How They Stretch

When you pull on many materials, like metals, they first act like a rubber band. If you let go, they spring back to their original shape. This is called elastic behavior. Look at Figure 1; this happens up to point 3.
But if you pull harder, especially on ductile materials like steel, they start to change shape permanently. This is called plastic deformation. If you let go now, the material won't go back to its original size. For many designs, engineers want to avoid this permanent change.
After a certain point (like point 2 in Figure 1, called the yield strength), ductile metals get stronger as you stretch them more. This is called strain hardening. But then, they start to get thinner in one spot, like a neck. This necking makes the material seem weaker if you only look at the original size.
The highest point on the graph (like point 1 in Figure 1) is the ultimate tensile strength. This is the maximum pulling force the material can handle before it starts to break.
For ductile materials, engineers usually design things based on the yield strength (when it starts to permanently change shape), not the ultimate tensile strength. This is because they don't want the material to permanently deform. However, ultimate tensile strength is still useful for checking the quality of materials and figuring out what kind of material something is.
For brittle materials, which don't have a clear yield point, the ultimate tensile strength is very important for design.
How We Test Materials

To test a material's tensile strength, a small, carefully shaped sample is used. A special machine called a tensometer pulls on this sample at a steady speed. It keeps pulling until the sample breaks into two pieces.
Sometimes, for metals, there's a quick way to guess their tensile strength. You can use a tool that measures how hard it is to make a dent in the metal. This is called indentation hardness. It often matches up with tensile strength. This quick test helps factories check the quality of large amounts of metal without needing to break a sample every time.
Common Tensile Strengths
Here's a table showing the typical ultimate tensile strengths for some common materials. Remember, these values can change a bit depending on how the material was made or how pure it is.
| Material | Yield strength (MPa) |
Ultimate tensile strength (MPa) |
Density (g/cm3) |
|---|---|---|---|
| Steel, common building (ASTM A36 steel) | 250 | 400–550 | 7.8 |
| Steel, mild (1090) | 247 | 841 | 7.58 |
| Chromium-vanadium steel (AISI 6150) | 620 | 940 | 7.8 |
| Steel, very strong (Maraging steel 2800) | 2617 | 2693 | 8.00 |
| Steel, super strong (AerMet 340) | 2160 | 2430 | 7.86 |
| Steel, special wire (Sandvik Sanicro 36Mo) | 1758 | 2070 | 8.00 |
| Steel, heat-treated (AISI 4130) | 951 | 1110 | 7.85 |
| Steel, pipeline (API 5L X65) | 448 | 531 | 7.8 |
| Steel, high strength alloy (ASTM A514) | 690 | 760 | 7.8 |
| Acrylic (clear plastic) | 72 | 87 | 1.16 |
| High-density polyethylene (HDPE) | 26–33 | 37 | 0.85 |
| Polypropylene | 12–43 | 19.7–80 | 0.91 |
| Steel, stainless (AISI 302) | 275 | 620 | 7.86 |
| Cast iron (4.5% Carbon) | 130 | 200 | 7.3 |
| "Liquidmetal" alloy | 1723 | 550–1600 | 6.1 |
| Beryllium (99.9% pure) | 345 | 448 | 1.84 |
| Aluminium alloy 2014-T6 | 414 | 483 | 2.8 |
| Polyester resin (plain) | 55 | 55 | |
| Polyester and chopped strand mat | 100 | 100 | |
| S-Glass epoxy composite | 2358 | 2358 | |
| Aluminium alloy 6061-T6 | 241 | 300 | 2.7 |
| Copper (99.9% pure) | 70 | 220 | 8.92 |
| Cupronickel (10% Nickel) | 130 | 350 | 8.94 |
| Brass | 200 + | 500 | 8.73 |
| Tungsten | 941 | 1510 | 19.25 |
| Glass | 33 | 2.53 | |
| E-Glass (fiber) | N/A | 1500 for laminates, 3450 for fibers alone |
2.57 |
| S-Glass (fiber) | N/A | 4710 | 2.48 |
| Basalt fiber | N/A | 4840 | 2.7 |
| Marble | N/A | 15 | 2.6 |
| Concrete | N/A | 2–5 | 2.7 |
| Carbon fiber | N/A | 1600 for laminates, 4137 for fibers alone |
1.75 |
| Carbon fiber (Toray T1100G) | 7000 fibre alone | 1.79 | |
| Human hair | 140–160 | 200–250 | |
| Bamboo fiber | 350–500 | 0.4–0.8 | |
| Spider silk | 1000 | 1.3 | |
| Spider silk, Darwin's bark spider | 1652 | ||
| Silkworm silk | 500 | 1.3 | |
| Aramid (Kevlar or Twaron) | 3620 | 3757 | 1.44 |
| UHMWPE | 24 | 52 | 0.97 |
| UHMWPE fibers (Dyneema or Spectra) | 2300–3500 | 0.97 | |
| Vectran | 2850–3340 | 1.4 | |
| Polybenzoxazole (Zylon) | 2700 | 5800 | 1.56 |
| Wood, pine (pulled along grain) | 40 | ||
| Bone (limb) | 104–121 | 130 | 1.6 |
| Nylon, molded | 75-85 | 1.15 | |
| Nylon fiber, drawn | 900 | 1.13 | |
| Epoxy adhesive | N/A | 12–30 | N/A |
| Rubber | N/A | 16 | |
| Boron | N/A | 3100 | 2.46 |
| Silicon, pure crystal | N/A | 7000 | 2.33 |
| Ultra-pure silica glass fiber-optic strands | 4100 | ||
| Sapphire (Al2O3) | 400 at 25 °C, 275 at 500 °C, 345 at 1000 °C |
1900 | 3.9–4.1 |
| Boron nitride nanotube | N/A | 33000 | 2.62 |
| Diamond | 1600 | 2800 ~80–90 GPa at microscale |
3.5 |
| Graphene | N/A | intrinsic 130000; engineering 50000–60000 |
1.0 |
| First carbon nanotube ropes | ? | 3600 | 1.3 |
| Carbon nanotube | N/A | 11000–63000 | 0.037–1.34 |
| Carbon nanotube composites | N/A | 1200 | N/A |
| Iron (pure single crystal) | 3 | 7.874 | |
| Limpet Patella vulgata teeth (natural super-strong material) | 4900 3000–6500 |
- Many of these values depend on how the material was made and how pure it is.
- The strongest material ever measured is a type of carbon nanotube. One measurement showed it could handle 63 GPa (gigapascals) of pulling force!
- The strength of spider silk can change a lot. It depends on the type of spider, the kind of silk, and even the temperature and how fast it's pulled. The 1000 MPa in the table is an average.
- The strength of human hair also changes based on a person's background and if their hair has been treated with chemicals.
Images for kids
-
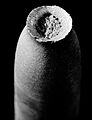
This is the "cup" side of a broken aluminum sample.
-
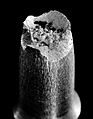
Here you can see both the "cup" and "cone" shapes of broken aluminum samples.


See Also
 In Spanish: Tensión de rotura para niños
- Flexural strength (how much a material can bend before breaking)
- Strength of materials (the study of how materials react to forces)
- Toughness (how much energy a material can absorb before breaking)
- Failure (when a material breaks or stops working)
- Tension (physics) (the pulling force)
- Young's modulus (how stiff a material is)
