Uxbridge (UK Parliament constituency) facts for kids
Quick facts for kids {{{Name}}}[[{{{Type}}} constituency]] |
|
|---|---|
| [[Image:{{{Map1}}}Constituency.svg|120px|]] [[Image:England{{{Map2}}}.svg|120px|]] |
|
| {{{Name}}} shown within [[{{{Entity}}}]], and {{{Entity}}} shown within England | |
| Created: | {{{Year}}} |
| MP: | {{{MP}}} |
| Party: | {{{Party}}} |
| Type: | House of Commons |
| County: | [[{{{County}}}]] |
| EP constituency: | [[{{{EP}}} (European Parliament constituency)|{{{EP}}}]] |
Uxbridge was a special area in the United Kingdom that elected one person to be a Member of Parliament (MP). An MP is like a representative for their local area. They work in the House of Commons, which is part of the UK Parliament.
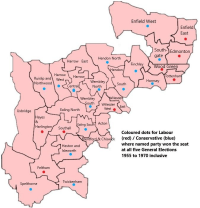
This area, called a constituency, existed from 1885 until 2010. For most of its history, 107 years, the MPs elected from Uxbridge were from the Conservative Party. For 18 years, the MPs were from the Labour Party. In its last 40 years, Uxbridge always elected a Conservative MP. However, in 1997, the Conservative MP won by only a small number of votes.
Over time, the size and shape of the Uxbridge area changed. This happened as more people moved into the surrounding areas. New constituencies were created to represent these growing populations.
Contents
What Were the Boundaries of Uxbridge?
The boundaries of the Uxbridge constituency changed several times over the years. This happened to make sure each MP represented a similar number of people.
Uxbridge's Original Shape (1885–1918)
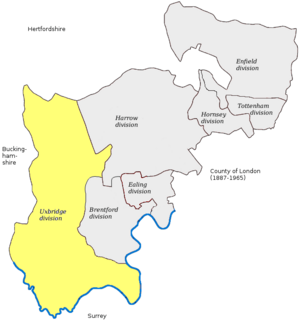
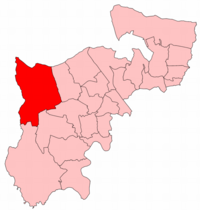
When it was first created in 1885, Uxbridge was the westernmost part of the county of Middlesex. It was a very large and oddly shaped area. It included many towns and villages like Uxbridge, Staines, Hayes, and Ruislip.
Some of these places, like Ashford and Staines, later became part of Surrey county in 1965. Other areas, like Uxbridge and Hillingdon, became part of Greater London.
How Uxbridge Changed Over Time
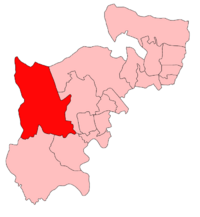
- 1918–1945: The Uxbridge area became much smaller. Large parts to the south were removed to create a new constituency called Spelthorne (UK Parliament constituency). The new Uxbridge included areas like Hayes, Ruislip-Northwood, and Southall.
- 1945–1950: Uxbridge was made even smaller. This was because the population had grown a lot. Parts of Uxbridge were used to create two new constituencies: Southall and Ealing West.
- 1950–1974: In 1950, another new constituency, Ruislip-Northwood, was formed in the north. Uxbridge then included its main town and nearby areas like Yiewsley and West Drayton. In 1965, all these areas became part of the London Borough of Hillingdon.
- 1974–1983: The way the constituency was classified changed. It became a "borough constituency," which means it was mainly made up of urban areas.
- 1983–1997: The names of the smaller areas (called wards) within Uxbridge changed, but the overall boundaries stayed the same.
- 1997–2010: The Harefield ward was moved out of Uxbridge and into the Ruislip-Northwood constituency.
What Happened After 2010?
After a review of how parliamentary areas were set up in North London, the Uxbridge constituency was officially closed in 2010. In its place, a new constituency called Uxbridge and South Ruislip was created. Some other areas from Uxbridge were moved into another new constituency called Ruislip, Northwood and Pinner.
Who Were the Members of Parliament for Uxbridge?
Many different people served as the MP for Uxbridge during its history. Here is a list of the MPs who represented the area:
| Election | Member | Party | Notes | |
|---|---|---|---|---|
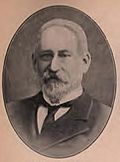
| 1885 | Sir Frederick Dixon-Hartland, Bt | Conservative | Known as Frederick Hartland before 1892. | |
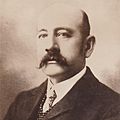
| Jan 1910 | Hon. Charles Mills | Conservative | Sadly, he died during World War I in France. | |
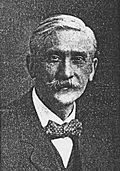
| 1915 by-election | Hon. Arthur Mills | Unionist | He was the brother of Charles Mills. | |
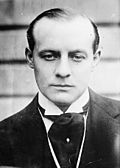
| 1918 | Col. Sidney Peel | Unionist | ||
| 1922 | Dennistoun Burney | Unionist | Also known as Dennis Burney. | |
| 1929 | Col. John Llewellin | Conservative | He later became a peer (a member of the House of Lords). | |
| 1945 | Frank Beswick | Labour | He also later became a peer. | |
| 1959 | Charles Curran | Conservative | ||
| 1966 | John Ryan | Labour | ||
| 1970 | Charles Curran | Conservative | ||
| 1972 by-election | Michael Shersby | Conservative | He was knighted in 1995 (became Sir Michael). | |
| 1997 by-election | John Randall | Conservative | He was knighted in 2013 and later became a peer. | |
How Were Elections Won in Uxbridge?
Elections are how people choose their MPs. Here are some examples of election results in Uxbridge, showing how different parties competed for the seat.
Early Elections (1880s-1900s)
In the very first election for Uxbridge in 1885, Frederick Dixon-Hartland won for the Conservatives. He received 5,093 votes, which was 66.1% of all votes. The Liberal candidate got 2,615 votes. This gave Dixon-Hartland a large lead of 2,478 votes.
| General election 1885: Uxbridge | |||||
|---|---|---|---|---|---|
| Party | Candidate | Votes | % | ±% | |
| Conservative | Frederick Dixon-Hartland | 5,093 | 66.1 | ||
| Liberal | James Pellatt Rickman | 2,615 | 33.9 | ||
| Majority | 2,478 | 32.2 | |||
| Turnout | 7,708 | 77.8 | |||
| Registered electors | 9,902 | ||||
| Conservative win (new seat) | |||||
Sometimes, a candidate would win without anyone else running against them. This is called being "unopposed." Frederick Dixon-Hartland won unopposed in 1886, 1895, and 1900.
In 1906, the election was much closer. Dixon-Hartland won again, but only by 145 votes!
| General election 1906: Uxbridge | |||||
|---|---|---|---|---|---|
| Party | Candidate | Votes | % | ±% | |
| Conservative | Frederick Dixon-Hartland | 6,429 | 50.6 | N/A | |
| Liberal | Sidney Job Pocock | 6,284 | 49.4 | New | |
| Majority | 145 | 1.2 | N/A | ||
| Turnout | 12,713 | 79.8 | N/A | ||
| Registered electors | 15,936 | ||||
| Conservative hold | Swing | N/A | |||
Elections in the 1910s
In January 1910, Charles Mills won for the Conservatives with a much larger lead. He got 10,116 votes.
| General election January 1910: Uxbridge | |||||
|---|---|---|---|---|---|
| Party | Candidate | Votes | % | ±% | |
| Conservative | Charles Mills | 10,116 | 65.2 | +14.6 | |
| Liberal | Sidney Job Pocock | 5,408 | 34.8 | -14.6 | |
| Majority | 4,708 | 30.4 | +29.2 | ||
| Turnout | 15,524 | 88.0 | +8.2 | ||
| Conservative hold | Swing | +14.6 | |||
In the 1918 election, Sidney Peel won for the Unionist Party (which was allied with the Conservatives). This was the first time the Labour Party had a candidate in Uxbridge, and they came in second place.
| General election 1918: Uxbridge | |||||
|---|---|---|---|---|---|
| Party | Candidate | Votes | % | ±% | |
| Unionist | *Sidney Peel | 9,814 | 59.1 | N/A | |
| Labour | Harry Gosling | 6,251 | 37.6 | New | |
| Liberal | Norman Mackenzie Snowball | 545 | 3.3 | New | |
| Majority | 3,563 | 21.5 | N/A | ||
| Turnout | 16,610 | 55.9 | N/A | ||
| Unionist hold | Swing | N/A | |||
Mid-Century Elections (1940s-1960s)
In 1945, after World War II, the Labour Party won the Uxbridge seat for the first time. Frank Beswick became the MP.
| General election 1945: Uxbridge | |||||
|---|---|---|---|---|---|
| Party | Candidate | Votes | % | ±% | |
| Labour | Frank Beswick | 25,190 | 43.74 | ||
| Conservative | John Llewellin | 24,106 | 41.85 | ||
| Liberal | John Ernest Aylett | 8,300 | 14.41 | ||
| Majority | 1,084 | 1.89 | N/A | ||
| Turnout | 57,596 | 73.93 | |||
| Labour Co-operative gain from Conservative | Swing | ||||
Frank Beswick continued to win for Labour in 1950, 1951, and 1955. However, in 1959, the Conservatives won the seat back with Charles Curran.
| General election 1959: Uxbridge | |||||
|---|---|---|---|---|---|
| Party | Candidate | Votes | % | ±% | |
| Conservative | Charles Curran | 22,360 | 46.51 | ||
| Labour | Frank Beswick | 20,970 | 43.62 | ||
| Liberal | Gordon Robert Goodall | 4,746 | 9.87 | New | |
| Majority | 1,390 | 2.89 | N/A | ||
| Turnout | 48,076 | 84.35 | |||
| Conservative gain from Labour Co-operative | Swing | ||||
The seat changed hands again in 1966, when John Ryan won for Labour.
| General election 1966: Uxbridge | |||||
|---|---|---|---|---|---|
| Party | Candidate | Votes | % | ±% | |
| Labour | John Ryan | 21,793 | 45.46 | ||
| Conservative | Charles Curran | 20,903 | 43.61 | ||
| Liberal | Gordon Robert Goodall | 5,241 | 10.93 | ||
| Majority | 890 | 1.85 | N/A | ||
| Turnout | 47,937 | 82.55 | |||
| Labour gain from Conservative | Swing | ||||
Later Elections (1970s-2000s)
From 1970 onwards, Uxbridge was consistently won by the Conservative Party. Charles Curran won back the seat in 1970.
| General election 1970: Uxbridge | |||||
|---|---|---|---|---|---|
| Party | Candidate | Votes | % | ±% | |
| Conservative | Charles Curran | 23,414 | 49.35 | +5.74 | |
| Labour | John Ryan | 19,768 | 41.66 | -3.80 | |
| Liberal | Gordon Robert Goodall | 4,265 | 8.99 | -1.94 | |
| Majority | 3,646 | 7.68 | N/A | ||
| Turnout | 47,447 | 74.95 | |||
| Conservative gain from Labour | Swing | ||||
After Charles Curran, Michael Shersby became the Conservative MP for Uxbridge in a special election (by-election) in 1972. He continued to win in general elections through the 1970s, 1980s, and 1990s.
| 1972 Uxbridge by-election | |||||
|---|---|---|---|---|---|
| Party | Candidate | Votes | % | ±% | |
| Conservative | Michael Shersby | 14,178 | 42.31 | -7.04 | |
| Labour | Manuela Sykes | 13,000 | 38.79 | -2.87 | |
| Liberal | Ian Stuart | 3,650 | 10.89 | +1.90 | |
| National Front | John Clifton | 2,920 | 8.71 | New | |
| Union Movement | Dan Harmston | 873 | 2.60 | New | |
| National Independence | Clare Macdonald | 551 | 1.64 | New | |
| Democratic Conservative against the Common Market | Reginald Simmerson | 341 | 1.02 | New | |
| Majority | 1,178 | 3.52 | -4.16 | ||
| Turnout | 35,513 | ||||
| Conservative hold | Swing | ||||
In 1997, Michael Shersby won the general election, but sadly passed away shortly after. Another by-election was held, and John Randall became the new Conservative MP for Uxbridge.
| 1997 Uxbridge by-election | |||||
|---|---|---|---|---|---|
| Party | Candidate | Votes | % | ±% | |
| Conservative | John Randall | 16,288 | 51.1 | +7.6 | |
| Labour | Andy Slaughter | 12,522 | 39.3 | −2.5 | |
| Liberal Democrats | Keith Kerr | 1,792 | 5.6 | −5.3 | |
| Monster Raving Loony | Screaming Lord Sutch | 396 | 1.3 | New | |
| Socialist Alternative | Julia Leonard | 259 | 0.8 | −0.1 | |
| BNP | Frances Taylor | 205 | 0.7 | New | |
| National Democrats | Ian Anderson | 157 | 0.5 | New | |
| National Front | John McAuley | 110 | 0.3 | New | |
| Independent Liberal | Henry Middleton | 69 | 0.2 | New | |
| UKIP | James Feisenberger | 39 | 0.1 | New | |
| Rainbow Dream Ticket | Ronnie Carroll | 30 | 0.1 | New | |
| Majority | 3,766 | 11.8 | +10.1 | ||
| Turnout | 31,867 | 55.2 | -16.9 | ||
| Conservative hold | Swing | ||||
John Randall continued to be the MP for Uxbridge until the constituency was abolished in 2010.
| General election 2005: Uxbridge | |||||
|---|---|---|---|---|---|
| Party | Candidate | Votes | % | ±% | |
| Conservative | John Randall | 16,840 | 49.0 | +1.9 | |
| Labour | Roderick Dubrow-Marshall | 10,669 | 31.0 | −9.9 | |
| Liberal Democrats | Tariq Mahmood | 4,544 | 13.2 | +2.9 | |
| BNP | Cliff le May | 763 | 2.2 | New | |
| Green | Stephen Young | 725 | 2.1 | New | |
| UKIP | Robert Kerby | 553 | 1.6 | −0.2 | |
| National Front | Peter Shaw | 284 | 0.8 | New | |
| Majority | 6,171 | 18.0 | +11.8 | ||
| Turnout | 34,378 | 59.4 | +1.9 | ||
| Conservative hold | Swing | +5.9 | |||
See also


