Kristinehamn Municipality facts for kids
Quick facts for kids
Kristinehamn Municipality
Kristinehamns kommun
|
||
---|---|---|
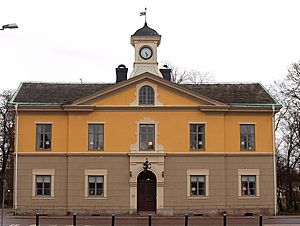
Kristinehamn City Hall
|
||
|
||
Country | Sweden | |
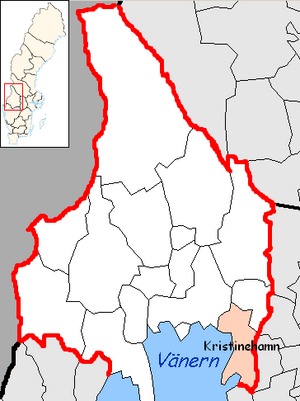
County | Värmland County | |
Seat | Kristinehamn | |
Area | ||
• Total | 1,392.37 km2 (537.60 sq mi) | |
• Land | 748.01 km2 (288.81 sq mi) | |
• Water | 644.36 km2 (248.79 sq mi) | |
Area as of January 1, 2010. | ||
Population
(June 30, 2012)
|
||
• Total | 23,977 | |
• Density | 17.2203/km2 (44.6003/sq mi) | |
Time zone | UTC+1 (CET) | |
• Summer (DST) | UTC+2 (CEST) | |
ISO 3166 code | SE | |
Province | Värmland | |
Municipal code | 1781 | |
Website | www.kristinehamn.se |
Kristinehamn Municipality (Kristinehamns kommun) is a municipality in Värmland County in west central Sweden. Its seat is located in the city of Kristinehamn.
The present municipality was created in 1971 when the former City of Kristinehamn was merged with parts of the two dissolved rural municipalities Visnum and Väse.
Contents
Localities
- Kristinehamn (seat)
- Björneborg
- Bäckhammar
- Ölme
Sites of interest
- The medieval island of Saxholmen, situated in the beautiful archipelago of Kristinehamn. There have been several archaeological excavations on the island during the past few years. There is a myth that once the cruel and hateful Saxe av Sachsen lived on the island with his wife and servants. His wife took off with her lover.
- Östervik chapel is a unique small church which has a fascinating history and architecture.
- Folk museum, the red-painted houses made of wood, the rushing of the water, and the bleating of the sheep make altogether a wonderful atmosphere and give you a memorable visit. Lundbomsgården is a middle-class home from the 19th century, the mill from the early 17th century.
- Värmlands Säby manor house has typical 18th century qualities with beautiful tiled stoves and painted tapestries. There is also a unique hedge maze consisting of 1,747 bushes.
Demographics
This is a demographic table based on Kristinehamn Municipality's electoral districts in the 2022 Swedish general election sourced from SVT's election platform, in turn taken from SCB official statistics.
In total there were 24,083 residents, including 18,945 Swedish citizens of voting age. 51.2% voted for the left coalition and 47.7% for the right coalition. Indicators are in percentage points except population totals and income.
Location | Residents | Citizen adults |
Left vote | Right vote | Employed | Swedish parents |
Foreign heritage |
Income SEK |
Degree |
---|---|---|---|---|---|---|---|---|---|
% | % | ||||||||
Björneborg | 1,198 | 880 | 53.6 | 45.1 | 64 | 74 | 26 | 20,654 | 20 |
Djurgården | 1,623 | 1,246 | 51.0 | 47.4 | 81 | 86 | 14 | 24,962 | 38 |
Enserud | 1,191 | 993 | 56.3 | 42.4 | 66 | 78 | 22 | 18,782 | 28 |
Fältet | 1,391 | 1,062 | 50.7 | 48.6 | 80 | 85 | 15 | 26,136 | 40 |
Innerstaden | 1,787 | 1,294 | 66.6 | 32.5 | 54 | 55 | 45 | 16,351 | 26 |
Kristinehamn NÖ | 1,492 | 1,253 | 50.2 | 48.3 | 77 | 88 | 12 | 23,973 | 36 |
Kristinehamn N | 1,404 | 1,112 | 48.9 | 50.5 | 84 | 91 | 9 | 27,645 | 38 |
Kristinehamn S | 1,995 | 1,617 | 43.6 | 55.9 | 77 | 89 | 11 | 22,223 | 29 |
Kristinehamn Ö | 2,273 | 1,744 | 52.8 | 46.7 | 84 | 88 | 12 | 26,637 | 39 |
Kurlanda | 1,622 | 1,263 | 46.8 | 52.7 | 74 | 86 | 14 | 23,601 | 28 |
Stenstaliden | 1,991 | 1,583 | 54.6 | 43.7 | 70 | 82 | 18 | 20,884 | 33 |
Strand | 1,469 | 1,072 | 46.9 | 51.6 | 79 | 89 | 11 | 26,228 | 39 |
Södermalm | 1,949 | 1,503 | 55.8 | 42.7 | 66 | 71 | 29 | 19,830 | 29 |
Ölme | 1,464 | 1,200 | 46.7 | 52.8 | 83 | 94 | 6 | 27,258 | 38 |
Ö Vålösundet | 1,234 | 1,123 | 48.0 | 51.1 | 75 | 86 | 14 | 22,243 | 38 |
Source: SVT |
Elections
These are the results of the elections in the municipality since the first election after the municipal reform, being held in 1973. The exact results of Sweden Democrats were not listed at a municipal level by SCB from 1988 to 1998 due to the party's small size at the time. "Turnout" denotes the percentage of eligible people casting any ballots, whereas "Votes" denotes the number of valid votes only.
Riksdag
Year | Turnout | Votes | V | S | MP | C | L | KD | M | SD | ND |
---|---|---|---|---|---|---|---|---|---|---|---|
1973 | 91.6 | 18,158 | 5.3 | 49.7 | 0.0 | 21.9 | 10.0 | 1.3 | 11.6 | 0.0 | 0.0 |
1976 | 92.5 | 18,977 | 4.2 | 47.7 | 0.0 | 22.7 | 10.9 | 1.2 | 13.1 | 0.0 | 0.0 |
1979 | 90.8 | 18,498 | 5.0 | 49.6 | 0.0 | 16.4 | 11.0 | 1.1 | 16.7 | 0.0 | 0.0 |
1982 | 91.8 | 18,487 | 4.9 | 53.2 | 1.1 | 13.3 | 6.2 | 1.4 | 19.8 | 0.0 | 0.0 |
1985 | 89.6 | 18,125 | 5.3 | 51.8 | 1.1 | 10.9 | 13.5 | 0.0 | 17.3 | 0.0 | 0.0 |
1988 | 85.3 | 17,040 | 6.1 | 50.5 | 4.3 | 10.5 | 12.7 | 2.1 | 13.7 | 0.0 | 0.0 |
1991 | 86.3 | 17,061 | 4.7 | 45.0 | 2.5 | 7.8 | 9.0 | 6.2 | 16.1 | 0.0 | 8.3 |
1994 | 87.2 | 17,156 | 7.3 | 52.5 | 4.3 | 6.8 | 7.0 | 3.2 | 17.5 | 0.0 | 1.0 |
1998 | 81.8 | 15,677 | 15.5 | 42.7 | 3.9 | 5.0 | 4.5 | 10.1 | 16.6 | 0.0 | 0.0 |
2002 | 81.2 | 14,888 | 9.5 | 42.0 | 4.2 | 8.6 | 12.2 | 8.3 | 12.0 | 1.4 | 0.0 |
2006 | 81.9 | 15,131 | 7.3 | 43.6 | 3.6 | 8.6 | 6.4 | 5.5 | 20.6 | 2.5 | 0.0 |
2010 | 84.6 | 15,925 | 6.3 | 40.6 | 5.5 | 6.1 | 6.1 | 4.4 | 25.4 | 4.5 | 0.0 |
2014 | 86.2 | 16,173 | 5.6 | 41.2 | 5.1 | 6.3 | 4.8 | 3.8 | 19.3 | 11.4 | 0.0 |
2018 | 86.8 | 16,088 | 7.6 | 34.1 | 3.0 | 8.8 | 5.5 | 5.9 | 16.0 | 18.0 | 0.0 |
Blocs
This lists the relative strength of the socialist and centre-right blocs since 1973, but parties not elected to the Riksdag are inserted as "other", including the Sweden Democrats results from 1988 to 2006, but also the Christian Democrats pre-1991 and the Greens in 1982, 1985 and 1991. The sources are identical to the table above. The coalition or government mandate marked in bold formed the government after the election. New Democracy got elected in 1991 but are still listed as "other" due to the short lifespan of the party.
Year | Turnout | Votes | Left | Right | SD | Other | Elected |
---|---|---|---|---|---|---|---|
1973 | 91.6 | 18,158 | 55.0 | 43.5 | 0.0 | 1.5 | 98.5 |
1976 | 92.5 | 18,977 | 51.9 | 46.7 | 0.0 | 1.4 | 98.6 |
1979 | 90.8 | 18,498 | 54.6 | 44.1 | 0.0 | 1.3 | 98.7 |
1982 | 91.8 | 18,487 | 58.1 | 39.3 | 0.0 | 2.6 | 97.4 |
1985 | 89.6 | 18,125 | 57.1 | 41.7 | 0.0 | 1.2 | 98.8 |
1988 | 85.3 | 17,040 | 60.9 | 36.9 | 0.0 | 2.2 | 97.8 |
1991 | 86.3 | 17,061 | 49.7 | 39.1 | 0.0 | 11.2 | 97.1 |
1994 | 87.2 | 17,156 | 64.1 | 34.5 | 0.0 | 1.4 | 98.6 |
1998 | 81.8 | 15,677 | 62.1 | 36.2 | 0.0 | 1.7 | 98.3 |
2002 | 81.2 | 14,888 | 55.7 | 41.1 | 0.0 | 3.2 | 96.8 |
2006 | 81.9 | 15,131 | 54.5 | 41.1 | 0.0 | 4.4 | 95.6 |
2010 | 84.6 | 15,925 | 52.4 | 42.0 | 4.5 | 1.1 | 98.9 |
2014 | 86.2 | 16,173 | 51.9 | 34.2 | 11.4 | 2.5 | 97.5 |
2018 | 86.8 | 16,088 | 44.7 | 36.1 | 18.0 | 1.3 | 98.7 |
International relations
Twin towns — Sister cities
The municipality is twinned with:
- Brodnica, Poland (since 2003)
- Elva, Estonia (since 1992)
- Farsund, Norway (since 1945)
- Rautavaara, Finland (since 1971)
- Seinäjoki, Finland (since 1945)
- Skagen, Denmark
See also
In Spanish: Municipio de Kristinehamn para niños