
Parliamentary constituencies in South West England facts for kids
The South West of England is a large region in the UK. It has special areas called parliamentary constituencies. Think of these as local areas that each choose one person to represent them in the UK Parliament. Since the 2010 general election, there have been 55 of these areas in the South West. Some are in towns (called borough constituencies), and others are in the countryside (called county constituencies).
In 2010, the Conservative Party won the most seats, with 36. The Liberal Democrats had 15 seats, and the Labour Party had 4. By the 2015 election, the Liberal Democrats lost almost all their seats, mostly to the Conservatives. The Conservatives ended up with 51 seats, and Labour still had 4. In the 2017 election, the Conservatives were still the biggest party with 47 seats, but Labour gained a few, getting 7, and the Liberal Democrats won 1. In the 2019 election, the Conservatives increased their seats to 48, while Labour kept their 6, and the Liberal Democrats held onto their one seat in Bath.
Contents
Understanding Parliamentary Constituencies in the South West
In the South West, each constituency elects a Member of Parliament (MP) to represent them in the UK Parliament. These MPs work to make sure the voices of the people in their local area are heard.
How Many Constituencies Are There?
Currently, the South West has 55 parliamentary constituencies. These are split into two types:
- 15 are borough constituencies, which are usually in towns or cities.
- 40 are county constituencies, which cover more rural or mixed areas.
Who Represents the South West?
Here's a look at the constituencies in the South West, who their MP is, and which county they are in. The symbols next to the MP's name tell you which political party they belong to: † Conservative ‡ Labour ¤ Liberal Democrat ♣ Green Party # Independent
| Constituency | Electorate | Majority | Member of Parliament | Nearest opposition | County | County Location | Constituency Map | ||
|---|---|---|---|---|---|---|---|---|---|
| Bath BC | 67,805 | 12,322 | Wera Hobhouse¤ | Annabel Tall† | Somerset (prev. Avon) | ||||
| Bournemouth East BC | 74,125 | 8,806 | Tobias Ellwood† | Corrie Drew‡ | Dorset | ||||
| Bournemouth West BC | 74,205 | 10,150 | Conor Burns† | David Stokes‡ | Dorset | ||||
| Bridgwater and West Somerset CC | 85,327 | 24,439 | Ian Liddell-Grainger† | Oliver Thornton‡ | Somerset | ||||
| Bristol East BC | 73,867 | 10,794 | Kerry McCarthy‡ | Sarah Codling† | Bristol (prev. Avon) | ||||
| Bristol North West BC | 76,273 | 5,692 | Darren Jones‡ | Mark Weston† | Bristol (prev. Avon) | ||||
| Bristol South BC | 84,079 | 9,859 | Karin Smyth‡ | Richard Morgan† | Bristol (prev. Avon) | ||||
| Bristol West BC | 99,253 | 28,219 | Thangam Debbonaire‡ | Carla Denyer♣ | Bristol (prev. Avon) | ||||
| Camborne and Redruth CC | 70,250 | 8,700 | George Eustice† | Paul Farmer‡ | Cornwall | ||||
| Central Devon CC | 74,926 | 17,721 | Mel Stride† | Lisa Webb‡ | Devon | ||||
| Cheltenham BC | 81,044 | 981 | Alex Chalk† | Max Wilkinson¤ | Gloucestershire | ||||
| Chippenham CC | 77,221 | 11,288 | Michelle Donelan† | Helen Belcher¤ | Wiltshire | ||||
| Christchurch CC | 71,520 | 24,617 | Christopher Chope† | Mike Cox¤ | Dorset | ||||
| Devizes CC | 73,372 | 23,983 | Danny Kruger† | Jo Waltham¤ | Wiltshire | ||||
| East Devon CC | 87,168 | 6,708 | Simon Jupp† | Claire Wright# | Devon | ||||
| Exeter BC | 82,054 | 10,403 | Ben Bradshaw‡ | John Gray† | Devon | ||||
| Filton and Bradley Stoke CC | 74,016 | 5,646 | Jack Lopresti† | Mhairi Threlfall‡ | Gloucestershire (prev. Avon) | ||||
| Forest of Dean CC | 71,438 | 15,869 | Mark Harper† | Di Martin‡ | Gloucestershire | ||||
| Gloucester BC | 81,319 | 10,277 | Richard Graham† | Fran Boait‡ | Gloucestershire | ||||
| Kingswood BC | 68,972 | 2,501 (2024) | Damien Egan‡ | Sam Bromiley† | Gloucestershire (prev. Avon) | ||||
| Mid Dorset and North Poole CC | 65,427 | 14,898 | Michael Tomlinson† | Vikki Slade¤ | Dorset | ||||
| Newton Abbot CC | 72,529 | 17,501 | Anne Marie Morris† | Martin Wrigley¤ | Devon | ||||
| North Cornwall CC | 69,935 | 14,752 | Scott Mann† | Danny Chambers¤ | Cornwall | ||||
| North Devon CC | 75,859 | 14,813 | Selaine Saxby† | Alex White¤ | Devon | ||||
| North Dorset CC | 76,765 | 24,301 | Simon Hoare† | David Chadwick¤ | Dorset | ||||
| North East Somerset CC | 73,692 | 14,729 | Jacob Rees-Mogg† | Mark Huband‡ | Somerset (prev. Avon) | ||||
| North Somerset CC | 80,194 | 17,536 | Liam Fox† | Hannah Young‡ | Somerset (prev. Avon) | ||||
| North Swindon CC | 82,441 | 16,171 | Justin Tomlinson† | Kate Linnegar‡ | Wiltshire | ||||
| North Wiltshire CC | 73,280 | 17,626 | James Gray† | Brian Matthew¤ | Wiltshire | ||||
| Plymouth, Moor View BC | 69,430 | 12,897 | Johnny Mercer† | Charlotte Holloway‡ | Devon | ||||
| Plymouth, Sutton and Devonport BC | 77,852 | 4,757 | Luke Pollard‡ | Rebecca Smith† | Devon | ||||
| Poole BC | 73,989 | 19,116 | Robert Syms† | Sue Aitkenhead‡ | Dorset | ||||
| Salisbury CC | 74,556 | 19,736 | John Glen† | Victoria Charleston¤ | Wiltshire | ||||
| Somerton and Frome CC | 85,866 | 19,213 | Sarah Dyke¤ | Faye Purbrick† | Somerset | ||||
| South Dorset CC | 73,809 | 17,153 | Richard Drax† | Carralyn Parkes‡ | Dorset | ||||
| South East Cornwall CC | 71,825 | 20,971 | Sheryll Murray† | Gareth Derrick‡ | Cornwall | ||||
| South Swindon CC | 73,118 | 6,625 | Robert Buckland† | Sarah Church‡ | Wiltshire | ||||
| South West Devon CC | 72,535 | 21,430 | Gary Streeter† | Alex Beverley‡ | Devon | ||||
| South West Wiltshire CC | 77,969 | 21,630 | Andrew Murrison† | Emily Pomroy-Smith‡ | Wiltshire | ||||
| St Austell and Newquay CC | 79,930 | 16,526 | Steve Double† | Felicity Owen‡ | Cornwall | ||||
| St Ives CC | 68,795 | 4,280 | Derek Thomas† | Andrew George¤ | Cornwall | ||||
| Stroud CC | 84,537 | 3,840 | Siobhan Baillie† | David Drew‡ | Gloucestershire | ||||
| Taunton Deane CC | 88,676 | 11,700 | Rebecca Pow† | Gideon Amos¤ | Somerset | ||||
| Tewkesbury CC | 83,958 | 22,410 | Laurence Robertson† | Alex Hegenbarth¤ | Gloucestershire | ||||
| The Cotswolds CC | 81,939 | 20,214 | Geoffrey Clifton-Brown† | Liz Webster¤ | Gloucestershire | ||||
| Thornbury and Yate CC | 69,492 | 12,369 | Luke Hall† | Claire Young¤ | Gloucestershire (prev. Avon) | ||||
| Tiverton and Honiton CC | 81,661 | 6,144 | Richard Foord¤ | Helen Hurford† | Devon | ||||
| Torbay BC | 75,054 | 17,749 | Kevin Foster† | Lee Howgate¤ | Devon | ||||
| Torridge and West Devon CC | 80,403 | 24,992 | Geoffrey Cox† | David Chalmers¤ | Devon | ||||
| Totnes CC | 69,863 | 12,724 | Anthony Mangnall† | Sarah Wollaston¤ | Devon | ||||
| Truro and Falmouth CC | 76,719 | 4,561 | Cherilyn Mackrory† | Jennifer Forbes‡ | Cornwall | ||||
| Wells CC | 84,124 | 9,991 | James Heappey† | Tessa Munt¤ | Somerset | ||||
| West Dorset CC | 81,897 | 14,106 | Chris Loder† | Edward Morello¤ | Dorset | ||||
| Weston-super-Mare CC | 82,526 | 17,121 | John Penrose† | Tim Taylor‡ | Somerset (prev. Avon) | ||||
| Yeovil CC | 82,468 | 16,181 | Marcus Fysh† | Mick Clark¤ | Somerset | ||||


Future Changes to Constituencies
The way constituencies are drawn can change over time. This is done by a group called the Boundary Commission for England. They make sure that each constituency has roughly the same number of voters.
Why Do Boundaries Change?
Boundaries change to keep things fair. As populations grow or shrink in different areas, the number of voters in each constituency can become very different. The Boundary Commission reviews these areas regularly to make sure each MP represents a similar number of people.
New Constituencies for the Next Election
The Boundary Commission has suggested some new constituencies for the South West. These changes will happen before the next general election. The number of seats in the South West will increase from 55 to 58.
Here are some of the proposed new constituencies:
| Constituency | Electorate | Ceremonial county | Local authority |
|---|---|---|---|
| Bath CC | 73,241 | Somerset | Bath and North East Somerset |
| Bournemouth East BC | 73,173 | Dorset | Bournemouth, Christchurch and Poole |
| Bournemouth West BC | 72,094 | Dorset | Bournemouth, Christchurch and Poole |
| Bridgwater CC | 71,418 | Somerset | Somerset |
| Bristol Central BC | 70,227 | Bristol | Bristol |
| Bristol East BC | 75,936 | Bristol | Bristol |
| Bristol North East BC | 69,793 | Bristol / Gloucestershire | Bristol / South Gloucestershire |
| Bristol North West BC | 76,783 | Bristol | Bristol |
| Bristol South BC | 74,696 | Bristol | Bristol |
| Camborne and Redruth CC | 73,568 | Cornwall | Cornwall |
| Central Devon CC | 73,491 | Devon | Mid Devon / Teignbridge / West Devon |
| Cheltenham BC | 75,292 | Gloucestershire | Cheltenham |
| Chippenham CC | 71,648 | Wiltshire | Wiltshire |
| Christchurch CC | 71,598 | Dorset | Bournemouth, Christchurch and Poole / Dorset |
| East Wiltshire CC | 71,109 | Wiltshire | Swindon / Wiltshire |
| Exeter BC | 71,713 | Devon | Exeter |
| Exmouth and Exeter East CC | 74,502 | Devon | East Devon / Exeter |
| Filton and Bradley Stoke CC | 73,598 | Gloucestershire | South Gloucestershire |
| Forest of Dean CC | 71,510 | Gloucestershire | Forest of Dean / Tewkesbury |
| Frome and East Somerset CC | 70,177 | Somerset | Bath and North East Somerset / Somerset |
| Glastonbury and Somerton CC | 70,015 | Somerset | Somerset |
| Gloucester BC | 76,695 | Gloucestershire | Gloucester |
| Honiton and Sidmouth CC | 74,365 | Devon | East Devon / Mid Devon |
| Melksham and Devizes CC | 71,823 | Wiltshire | Wiltshire |
| Mid Dorset and North Poole CC | 74,305 | Dorset | Bournemouth, Christchurch and Poole / Dorset |
| Newton Abbot CC | 72,956 | Devon | Teignbridge |
| North Cornwall CC | 75,034 | Cornwall | Cornwall |
| North Cotswolds CC | 70,915 | Gloucestershire | Cotswold / Stroud / Tewkesbury |
| North Devon CC | 76,455 | Devon | North Devon |
| North Dorset CC | 72,109 | Dorset | Dorset |
| North East Somerset and Hanham CC | 73,113 | Gloucestershire / Somerset | Bath and North East Somerset / South Gloucestershire |
| North Somerset CC | 73,963 | Somerset | North Somerset |
| Plymouth Moor View BC | 73,378 | Devon | Plymouth |
| Plymouth Sutton and Devonport BC | 73,495 | Devon | Plymouth |
| Poole BC | 72,162 | Dorset | Bournemouth, Christchurch and Poole |
| Salisbury CC | 70,242 | Wiltshire | Wiltshire |
| South Cotswolds CC | 72,865 | Gloucestershire / Wiltshire | Cotswold / Stroud / Wiltshire |
| South Devon CC | 71,691 | Devon | South Hams / Torbay |
| South Dorset CC | 76,640 | Dorset | Dorset |
| South East Cornwall CC | 71,734 | Cornwall | Cornwall |
| South West Devon CC | 75,371 | Devon | Plymouth / South Hams / West Devon |
| South West Wiltshire CC | 71,551 | Wiltshire | Wiltshire |
| St Austell and Newquay CC | 74,585 | Cornwall | Cornwall |
| St Ives CC | 70,107 | Cornwall | Cornwall / Isles of Scilly |
| Stroud CC | 76,249 | Gloucestershire | Stroud |
| Swindon North CC | 72,163 | Wiltshire | Swindon |
| Swindon South BC | 72,468 | Wiltshire | Swindon |
| Taunton and Wellington CC | 76,049 | Somerset | Somerset |
| Tewkesbury CC | 72,426 | Gloucestershire | Cheltenham / Gloucester / Tewkesbury |
| Thornbury and Yate CC | 74,985 | Gloucestershire | South Gloucestershire |
| Tiverton and Minehead CC | 70,829 | Devon / Somerset | Mid Devon / Somerset |
| Torbay BC | 75,742 | Devon | Torbay |
| Torridge and Tavistock CC | 74,802 | Devon | Torridge / West Devon |
| Truro and Falmouth CC | 73,326 | Cornwall | Cornwall |
| Wells and Mendip Hills CC | 69,843 | Somerset | North Somerset / Somerset |
| West Dorset CC | 75,390 | Dorset | Dorset |
| Weston-super-Mare CC | 70,722 | Somerset | North Somerset |
| Yeovil CC | 76,056 | Somerset | Somerset |
Election Results in the South West
This section looks at how people in the South West have voted in recent general elections. It shows which parties got the most votes and how many seats they won.
2019 General Election Results
In the 2019 general election, here's how the votes were split among the main political parties in the South West:
| Party | Votes | % | Change from 2017 | Seats | Change from 2017 |
|---|---|---|---|---|---|
| Conservative | 1,612,090 | 52.8% | 48 | ||
| Labour | 713,226 | 23.3% | 6 | ||
| Liberal Democrats | 554,500 | 18.2% | 1 | 0 | |
| Greens | 115,011 | 3.8% | 0 | 0 | |
| Brexit | 11,139 | 0.4% | new | 0 | 0 |
| Others | 47,411 | 1.5% | 0 | 0 | |
| Total | 3,053,377 | 100.0 | 55 |
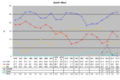
Historical Voting Trends: Percentage of Votes
This chart shows how the percentage of votes for different parties in the South West has changed over time.

- CON - Conservative Party (includes National Liberal Party up to 1966)
- LAB - Labour Party
- LIB - Liberal Party (up to 1979); SDP-Liberal Alliance (1983 & 1987); Liberal Democrats (from 1992)
- UKIP/Br - UK Independence Party (2010 to 2017); Brexit Party (2019)
- Green - Green Party of England and Wales
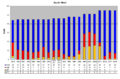
Historical Voting Trends: Number of Seats Won
This chart shows how the number of seats won by different parties in the South West has changed over time.

- CON - Conservative Party (includes National Liberal Party up to 1966)
- LAB - Labour Party
- LIB - Liberal Party (up to 1979); SDP-Liberal Alliance (1983 & 1987); Liberal Democrats (from 1992)
- OTH - Other parties or independent politicians. For example, in 1945, this included an Independent Progressive and an Independent National MP.
Images for kids
-
Location of Avon
-
Location of Dorset
-
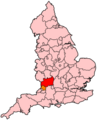
Location of Somerset
-
Location of Cornwall
-
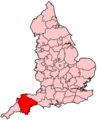
Location of Devon
-
Location of Gloucestershire
-
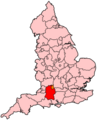
Location of Wiltshire
-
Map of Bath constituency
-

Map of Bournemouth East constituency
-
Map of Bournemouth West constituency
-
Map of Bridgwater and West Somerset constituency
-
Map of Bristol East constituency
-
Map of Bristol North West constituency
-
Map of Bristol South constituency
-
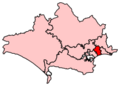
Map of Bristol West constituency
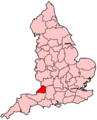
-
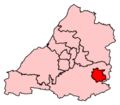
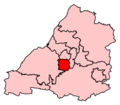
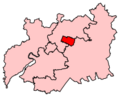
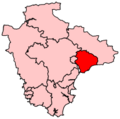
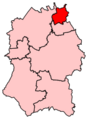
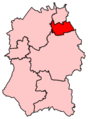
A small constituency. It is situated in the south west of the county, although it borders another constituency located further south west.
-
Map of Central Devon constituency
-
Map of Cheltenham constituency
-
Map of Chippenham constituency
-
Map of Christchurch constituency
-
Map of Devizes constituency
-
Map of East Devon constituency
-

Map of Exeter constituency
-
Map of Filton and Bradley Stoke constituency
-
Map of Forest of Dean constituency
-
Map of Gloucester constituency
-
Map of Kingswood constituency
-
Map of Mid Dorset and North Poole constituency
-
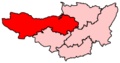
Map of Newton Abbot constituency
-
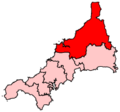
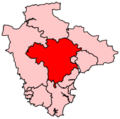
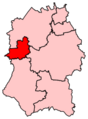
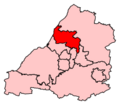
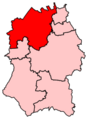
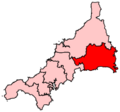
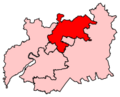
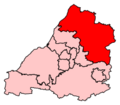
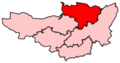
A large constituency in the north of the county.
-
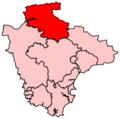
Map of North Devon constituency
-
Map of North Dorset constituency
-
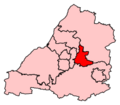
Map of North East Somerset constituency
-
Map of North Somerset constituency
-
Map of North Swindon constituency
-
Map of North Wiltshire constituency
-

Map of Plymouth, Moor View constituency
-
Map of Plymouth, Sutton and Devonport constituency
-
Map of Poole constituency
-
Map of Salisbury constituency
-
Map of Somerton and Frome constituency
-
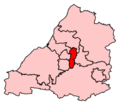
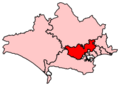
Map of South Dorset constituency
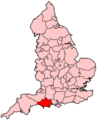
-
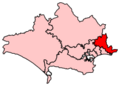
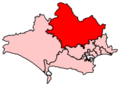
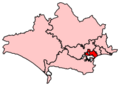
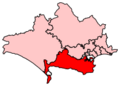
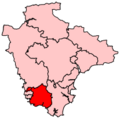
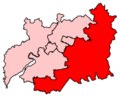
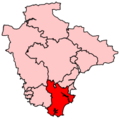
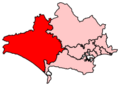
A medium-sized constituency found in the south east of the county.
-
Map of South Swindon constituency
-
Map of South West Devon constituency
-
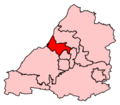
Map of South West Wiltshire constituency
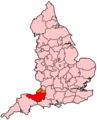
-
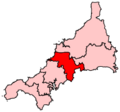
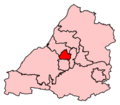
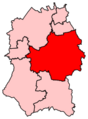
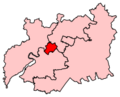
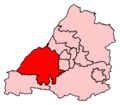
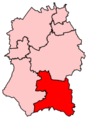
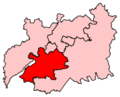
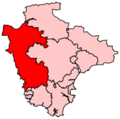
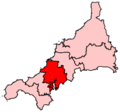
A medium constituency located in the center of the county.
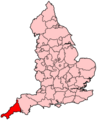
-
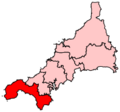
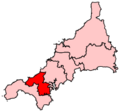
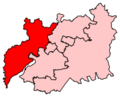
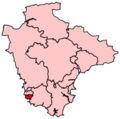
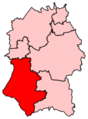
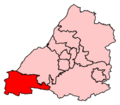
A medium constituency located in the extreme south west of the county.
-
Map of Stroud constituency
-

Map of Taunton Deane constituency
-
Map of Tewkesbury constituency
-
Map of The Cotswolds constituency
-
Map of Thornbury and Yate constituency
-
Map of Tiverton and Honiton constituency
-

Map of Torbay constituency
-
Map of Torridge and West Devon constituency
-
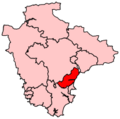
Map of Totnes constituency
-
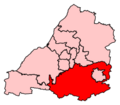
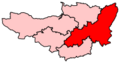
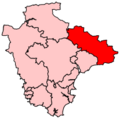
A medium constituency located in the centre of the county. Due to the elongated shape of the county, no constituencies border it to the north or the south despite its central location.
-
Map of Wells constituency
-
Map of West Dorset constituency
-
Map of Weston-super-Mare constituency
-
Map of Yeovil constituency
-
South West votes percentage
-
South West seats
See also
- List of United Kingdom Parliament constituencies
- List of parliamentary constituencies in Avon
- List of parliamentary constituencies in Cornwall
- List of parliamentary constituencies in Devon
- List of parliamentary constituencies in Dorset
- List of parliamentary constituencies in Gloucestershire
- List of parliamentary constituencies in Somerset
- List of parliamentary constituencies in Wiltshire
