
Results of the Republican Party presidential primaries, 2016 facts for kids
|
|||||||||||||||||||||||||||||
|
2,472 delegates to the Republican National Convention 1,237 delegates votes needed to win |
|||||||||||||||||||||||||||||
|---|---|---|---|---|---|---|---|---|---|---|---|---|---|---|---|---|---|---|---|---|---|---|---|---|---|---|---|---|---|
|
|||||||||||||||||||||||||||||

First place (popular vote or delegate count)
Donald Trump Ted Cruz Marco Rubio John Kasich
|
|||||||||||||||||||||||||||||
|
|||||||||||||||||||||||||||||
The Republican Party presidential primaries in 2016 were a series of elections. These elections helped the Republican Party choose their best candidate for President. People in each state voted for the person they thought would be a good president. Each candidate earned a certain number of "delegates" based on how many votes they received. Delegates are like representatives who vote for a candidate at a big meeting called the 2016 Republican National Convention.
The primaries started on February 1, 2016, in Iowa. By May 4, 2016, Donald Trump had won enough delegates to become the unofficial nominee for the Republican Party.
Main Candidates
Many people ran to become the Republican candidate for president. Here are the main candidates who had big campaigns:
| Candidate | Most recent position | Announced | Withdrew | State |
|---|---|---|---|---|
| Jeb Bush | Governor | June 15, 2015 | February 20, 2016 | Florida |
| Ben Carson | Director of Pediatric Neurosurgery | May 4, 2015 | March 4, 2016 | Maryland |
| Chris Christie | Governor | June 30, 2015 | February 10, 2016 | New Jersey |
| Ted Cruz | Senator | March 23, 2015 | May 3, 2016 | Texas |
| Carly Fiorina | Chief Executive Officer | May 4, 2015 | February 10, 2016 | Virginia |
| Jim Gilmore | Governor | July 30, 2015 | February 12, 2016 | Virginia |
| Lindsey Graham | Senator | June 1, 2015 | December 21, 2015 | South Carolina |
| Mike Huckabee | Governor | May 5, 2015 | February 1, 2016 | Arkansas |
| Bobby Jindal | Governor | June 24, 2015 | November 17, 2015 | Louisiana |
| John Kasich | Governor | July 21, 2015 | Ohio | |
| George Pataki | Governor | May 28, 2015 | December 29, 2015 | New York |
| Rick Perry | Governor | June 4, 2015 | September 11, 2015 | Texas |
| Rand Paul | Senator | April 7, 2015 | February 3, 2016 | Kentucky |
| Marco Rubio | Senator | April 13, 2015 | March 15, 2016 | Florida |
| Rick Santorum | Senator | May 27, 2015 | February 3, 2016 | Pennsylvania |
| Donald Trump | Chairman | June 16, 2015 | New York | |
| Scott Walker | Governor | July 13, 2015 | September 21, 2015 | Wisconsin |
Results
This table shows the results for the top seven candidates who ran in the primaries. It includes how many delegates they won and their total popular votes.
Top Seven Candidates
| Candidates | .jpg) Donald Trump |
 Ted Cruz |
 Marco Rubio |
.jpg) John Kasich |
 Ben Carson |
 Jeb Bush |
_(cropped).jpg) Carly Fiorina |
|
|---|---|---|---|---|---|---|---|---|
| Total delegates | 956 | 551 | 173 | 154 | 9 | 4 | 1 | |
| Popular votes | 10,128,992 | 6,918,237 | 3,475,037 | 3,675,595 | 699,512 | 258,110 | 35,947 | |
| Results | ||||||||
| Feb 1 | Iowa | 24% | 28% | 23% | 2% | 9% | 3% | 2% |
| Feb 9 | New Hampshire | 35% | 12% | 11% | 16% | 2% | 11% | 4% |
| Feb 20 | South Carolina | 33% | 22% | 22% | 8% | 7% | 8% | |
| Feb 23 | Nevada | 46% | 21% | 24% | 4% | 5% | ||
| March 1 | Alabama | 43% | 21% | 19% | 4% | 10% | ||
| Alaska | 34% | 36% | 15% | 4% | 11% | |||
| Arkansas | 33% | 31% | 25% | 4% | 6% | |||
| Georgia | 39% | 24% | 24% | 6% | 6% | |||
| Massachusetts | 50% | 10% | 18% | 18% | 3% | |||
| Minnesota | 21% | 29% | 37% | 6% | 7% | |||
| Oklahoma | 28% | 34% | 26% | 4% | 6% | |||
| Tennessee | 39% | 25% | 21% | 5% | 8% | |||
| Texas | 27% | 44% | 18% | 4% | 4% | |||
| Vermont | 33% | 10% | 19% | 30% | 4% | |||
| Virginia | 35% | 17% | 32% | 9% | 6% | |||
| March 5 | Kansas | 23% | 48% | 17% | 11% | |||
| Kentucky | 36% | 32% | 16% | 14% | ||||
| Louisiana | 41% | 38% | 11% | 6% | ||||
| Maine | 33% | 46% | 8% | 12% | ||||
| March 6 | Puerto Rico | 13% | 9% | 71% | 1% | |||
| March 8 | Hawaii | 42% | 33% | 13% | 11% | |||
| Idaho | 28% | 45% | 16% | 7% | ||||
| Michigan | 37% | 25% | 9% | 24% | ||||
| Mississippi | 47% | 36% | 5% | 9% | ||||
| March 12 | District of Colombia | 14% | 12% | 37% | 36% | |||
| Wyoming | 7% | 66% | 20% | 0% | ||||
| March 15 | Florida | 46% | 17% | 27% | 7% | |||
| Illinois | 39% | 30% | 9% | 20% | ||||
| Missouri | 41% | 41% | 6% | 10% | ||||
| North Carolina | 40% | 37% | 8% | 13% | ||||
| North Marianas | 73% | 24% | 1% | 2% | ||||
| Ohio | 36% | 13% | 3% | 47% | ||||
| March 22 | Arizona | 47% | 25% | 10% | ||||
| Utah | 14% | 69% | 17% | |||||
| April 1-3 | North Dakota | ?% | ?% | ? | ||||
| April 5 | Wisconsin | 35% | 48% | 14% | ||||
| April 7-9 | Colorado | ? | ?% | ? | ||||
| April 14-16 | Wyoming | ? | ?% | ? | ||||
| April 19 | New York | 60% | 15% | 25% | ||||
| April 26 | Connecticut | 58% | 12% | 29% | ||||
| Delaware | 61% | 16% | 20% | |||||
| Maryland | 54% | 19% | 23% | |||||
| Pennsylvania | 57% | 22% | 19% | |||||
| Rhode Island | 64% | 10% | 24% | |||||
| % of popular vote | 40% | 27% | 15% | 14% | 3% | 1% | 0% | |
Legend: 1st place
- Only states that voted with pledged delegates are shown. The states/territories that voted for unpledged delegates are North Dakota, Colorado, Wyoming and Virgin Islands.
Statistics

Images for kids
-
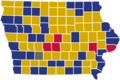
Results of the Iowa Republican caucus, 2016
-

Results of the New Hampshire Primary, 2016
-

South Carolina Republican Presidential Primary Election Results by County, 2016.
-

Nevada Republican Presidential Caucuses Election Results by County, 2016.
-

County results of the Alabama Republican presidential primaries, 2016
-

County results of the Alaska Republican presidential primaries, 2016
-
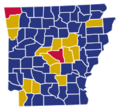
County results of the Arkansas Republican presidential caucuses, 2016.
-
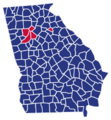
County results of the Georgia Republican presidential primaries, 2016
-

County results of the Massachusetts Republican presidential primaries, 2016
-

County results of the Minnesota Republican presidential primaries, 2016
-
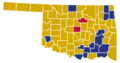
County results of the Oklahoma Republican presidential caucuses, 2016.
-

County results of the Tennessee Republican presidential primaries, 2016
-
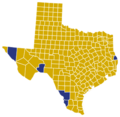
County results of the Texas Republican presidential caucuses, 2016.
-

County results of the Vermont Republican presidential primaries, 2016.
-

County results of the Virginia Republican presidential caucuses, 2016.
-

County results of the Kentucky Republican presidential caucuses, 2016
-
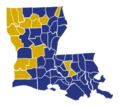
County results of the Louisiana Republican presidential caucuses, 2016
-

County results of the Maine Republican presidential primaries, 2016


Related Pages
