Show Low, Arizona facts for kids
Quick facts for kids
Show Low
|
||
|---|---|---|
 |
||
|
||
| Motto(s):
"Named By The Turn Of A Card"
|
||
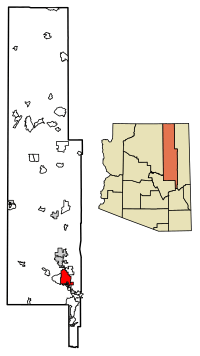
Location of Show Low in Navajo County, Arizona
|
||
| Country | United States | |
| State | Arizona | |
| County | Navajo | |
| Founded | 1870 | |
| Incorporated | 1953 | |
| Government | ||
| • Type | Council–Manager | |
| • Body | Show Low City Council | |
| Area | ||
| • Total | 65.98 sq mi (170.88 km2) | |
| • Land | 65.50 sq mi (169.66 km2) | |
| • Water | 0.47 sq mi (1.23 km2) | |
| Elevation | 6,349 ft (1,935 m) | |
| Population
(2020)
|
||
| • Total | 11,732 | |
| • Density | 179.10/sq mi (69.15/km2) | |
| Time zone | UTC−7 (Mountain) | |
| • Summer (DST) | UTC−7 (no DST/PDT) | |
| ZIP Codes |
85901, 85902, 85911
|
|
| Area code(s) | 928 | |
| FIPS code | 04-66470 | |
| GNIS ID(s) | 2411895 | |
| Major airport | Show Low Regional Airport | |
| U.S. Highways | ||
| State Routes | ||
| U.S. Decennial Census | ||
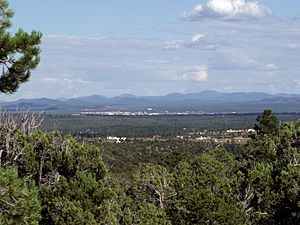
Show Low is a city in Navajo County, Arizona. It is located on the Mogollon Rim in east-central Arizona. The city sits at a high elevation of about 6,345 feet (1,934 meters). Show Low was started in 1870 and became an official city in 1953. In 2020, about 11,732 people lived there.
Contents
What's in a Name? The Story of Show Low
The city of Show Low has a very interesting name! It comes from an old legend about a long poker game. Two men, Corydon E. Cooley and Marion Clark, owned a huge ranch together. They decided the ranch wasn't big enough for both of them. So, they played a card game called "Seven Up" to decide who would keep the ranch. The loser would have to leave.
The game went on for a very long time, and neither player seemed to be winning. Finally, Clark told Cooley, "If you can show low, you win." This meant if Cooley could show the lowest card, he would win the ranch. Cooley then showed the deuce of clubs, which is the lowest card possible! He said, "Show low it is." Because of this story, the main street in Show Low is called "Deuce of Clubs."
Show Low and the Rodeo–Chediski Fire
In 2002, a very large forest fire called the Rodeo–Chediski Fire came close to Show Low. People living in the city had to leave their homes for safety. Luckily, the fire was put out less than half a mile from the city's edge. Show Low was completely saved from the fire. The city is close to many forests and is a popular place for outdoor activities.
Where is Show Low Located?
Show Low covers an area of about 27.9 square miles (72.3 square kilometers). Most of this area is land. Only a small part, about 0.1 square miles (0.25 square kilometers), is water.
Show Low's Weather and Climate
Show Low has different weather depending on the season.
Winters in Show Low
In winter, from November to March, the daytime temperatures are usually between 45°F (7°C) and 55°F (13°C). At night, it often gets below freezing. In December and February, nighttime temperatures average in the 20s (°F). In November and March, they are usually in the low 30s (°F).
Summers in Show Low
During the summer, daytime temperatures in Show Low are usually around 85°F (29°C). Sometimes, it can get a bit hotter, above 90°F (32°C). When the sun goes down in the summer, the temperature drops a lot, sometimes by as much as 30°F (17°C)! This means summer nights are cool, usually between 50°F (10°C) and 60°F (16°C).
Temperature Records
Show Low has had freezing temperatures in every month except July and August. The coldest temperature ever recorded in Show Low was -25°F (-32°C) on January 8, 1971. The hottest temperature was 100°F (38°C), which happened twice: on May 31, 1969, and July 14, 2003.
Rainfall and Snowfall
On average, Show Low gets about 15.7 inches (399 mm) of rain each year. The city has a Mediterranean climate, but unlike many places with this climate, most of its rain falls in the summer. This is because of the North American Monsoon, which brings summer thunderstorms. Show Low also gets some snow, averaging about 19.4 inches (49.3 cm) per year.
| Climate data for Show Low Airport, Arizona (1991–2020 normals, extremes 1984–present) | |||||||||||||
|---|---|---|---|---|---|---|---|---|---|---|---|---|---|
| Month | Jan | Feb | Mar | Apr | May | Jun | Jul | Aug | Sep | Oct | Nov | Dec | Year |
| Record high °F (°C) | 69 (21) |
71 (22) |
80 (27) |
84 (29) |
94 (34) |
98 (37) |
100 (38) |
97 (36) |
93 (34) |
86 (30) |
76 (24) |
68 (20) |
100 (38) |
| Mean maximum °F (°C) | 59.4 (15.2) |
63.9 (17.7) |
70.9 (21.6) |
77.2 (25.1) |
85.5 (29.7) |
93.3 (34.1) |
94.5 (34.7) |
90.9 (32.7) |
86.9 (30.5) |
79.9 (26.6) |
70.0 (21.1) |
61.4 (16.3) |
95.5 (35.3) |
| Mean daily maximum °F (°C) | 46.0 (7.8) |
51.0 (10.6) |
58.0 (14.4) |
64.9 (18.3) |
73.6 (23.1) |
83.9 (28.8) |
85.3 (29.6) |
82.8 (28.2) |
78.3 (25.7) |
68.1 (20.1) |
56.4 (13.6) |
45.8 (7.7) |
66.2 (19.0) |
| Daily mean °F (°C) | 34.8 (1.6) |
38.9 (3.8) |
44.7 (7.1) |
50.9 (10.5) |
59.0 (15.0) |
68.8 (20.4) |
72.2 (22.3) |
70.2 (21.2) |
65.1 (18.4) |
54.3 (12.4) |
43.7 (6.5) |
34.6 (1.4) |
53.1 (11.7) |
| Mean daily minimum °F (°C) | 23.6 (−4.7) |
26.8 (−2.9) |
31.3 (−0.4) |
36.8 (2.7) |
44.5 (6.9) |
53.7 (12.1) |
59.2 (15.1) |
57.7 (14.3) |
52.0 (11.1) |
40.6 (4.8) |
31.0 (−0.6) |
23.4 (−4.8) |
40.1 (4.5) |
| Mean minimum °F (°C) | 4.8 (−15.1) |
10.9 (−11.7) |
17.1 (−8.3) |
22.9 (−5.1) |
31.3 (−0.4) |
41.6 (5.3) |
52.2 (11.2) |
50.6 (10.3) |
39.4 (4.1) |
24.4 (−4.2) |
14.0 (−10.0) |
4.9 (−15.1) |
1.6 (−16.9) |
| Record low °F (°C) | −14 (−26) |
−11 (−24) |
5 (−15) |
12 (−11) |
23 (−5) |
33 (1) |
40 (4) |
38 (3) |
29 (−2) |
6 (−14) |
1 (−17) |
−22 (−30) |
−22 (−30) |
| Average precipitation inches (mm) | 1.35 (34) |
1.16 (29) |
0.91 (23) |
0.57 (14) |
0.62 (16) |
0.42 (11) |
2.35 (60) |
2.97 (75) |
1.44 (37) |
1.35 (34) |
1.19 (30) |
1.37 (35) |
15.70 (399) |
| Average snowfall inches (cm) | 4.0 (10) |
3.8 (9.7) |
2.3 (5.8) |
1.6 (4.1) |
0.0 (0.0) |
0.0 (0.0) |
0.0 (0.0) |
0.0 (0.0) |
0.0 (0.0) |
0.4 (1.0) |
1.9 (4.8) |
5.4 (14) |
19.4 (49) |
| Average precipitation days (≥ 0.01 in) | 6.9 | 6.5 | 5.7 | 4.1 | 4.3 | 2.9 | 12.9 | 14.9 | 7.4 | 5.6 | 4.7 | 6.5 | 82.4 |
| Average snowy days (≥ 0.1 in) | 2.0 | 1.6 | 0.9 | 0.5 | 0.0 | 0.0 | 0.0 | 0.0 | 0.0 | 0.2 | 0.9 | 1.7 | 7.8 |
| Source: NOAA | |||||||||||||
Who Lives in Show Low?
| Historical population | |||
|---|---|---|---|
| Census | Pop. | %± | |
| 1910 | 201 | — | |
| 1920 | 258 | 28.4% | |
| 1930 | 315 | 22.1% | |
| 1960 | 1,625 | — | |
| 1970 | 2,129 | 31.0% | |
| 1980 | 4,298 | 101.9% | |
| 1990 | 5,019 | 16.8% | |
| 2000 | 7,695 | 53.3% | |
| 2010 | 10,660 | 38.5% | |
| 2020 | 11,732 | 10.1% | |
| U.S. Decennial Census | |||
In 2000, there were 7,695 people living in Show Low. These people lived in 2,885 households. About 34.8% of these households had children under 18 living there. The average household had 2.62 people.
The population was spread out by age. About 29.2% of the people were under 18 years old. About 15.0% were 65 years or older. The average age in the city was 37 years.
How Do People Get Around in Show Low?
Show Low has its own airport, the Show Low Regional Airport. You can fly from here to Phoenix. The airport also handles cargo and private planes.
The city also has a small public transportation system. It works with the nearby town of Pinetop-Lakeside. There are two shuttle buses that stop at many stores, offices, and even the airport. There's also a bus called the White Mountain Connection. It connects Show Low to other towns like Taylor, Snowflake, and Holbrook. You can also take a daily shuttle from Show Low to Phoenix.
Learning and Schools in Show Low
Most of Show Low is part of the Show Low Unified School District. Some parts of the city are in the Blue Ridge Unified School District.
Schools in the Show Low Unified School District include:
- Linden Elementary
- Nikolaus Homestead Elementary
- Whipple Ranch Elementary
- White Mountain Institute
- Show Low Junior High School
- Show Low High School
There is also a private school called St. Anthony School (K-8). For older students, Northland Pioneer College has one of its main campuses in Show Low. It's called the White Mountain Campus.
What Are the Main Jobs in Show Low?
Show Low has several important employers that provide many jobs for its residents. Here are some of the top employers in the city:
| # | Employer | # of Employees |
|---|---|---|
| 1 | Summit Healthcare Regional Medical Center | 900 |
| 2 | Walmart | 490 |
| 3 | Show Low Unified School District | 300 |
| 4 | Cellular One | 187 |
| 5 | City of Show Low | 153 |
| 6 | The Home Depot | 150 |
| 7 | Citizens Telecommunications Company of the White Mountains | 125 |
| 8 | Northland Pioneer College | 110 |
| 9 | Lowe's | 108 |
| 10 | Tate's Auto Group | 70 |
Famous People from Show Low
- Doug Mathis – He used to be a relief pitcher for the Texas Rangers baseball team.
- Paul Ulibarri – He is a professional disc golfer. He won the PDGA Amateur Disc Golf World Champion title in 2006.
Nearby Cities and Towns
See also
 In Spanish: Show Low para niños
 | George Robert Carruthers |
 | Patricia Bath |
 | Jan Ernst Matzeliger |
 | Alexander Miles |


