
Accumulated cyclone energy facts for kids
Accumulated Cyclone Energy (ACE) is a way to measure how much energy a tropical cyclone releases during its entire life. Think of it like a score for how powerful and long-lasting a storm is!
Scientists figure out ACE by adding up the square of a storm's strongest winds every six hours. The total number is then usually divided by 10,000 to make it easier to read. This helps scientists compare different storms or even entire storm seasons.
The idea for this calculation came from William M. Gray and his team at Colorado State University. They first called it the Hurricane Destruction Potential index. Later, in 2000, the United States National Oceanic and Atmospheric Administration (NOAA) changed it to include all tropical cyclones with winds above 35 kn (65 km/h; 40 mph) and renamed it Accumulated Cyclone Energy. Other weather groups, like the Australian Bureau of Meteorology and the India Meteorological Department, now use it too.
The highest ACE ever recorded for a single tropical cyclone was 87.01. This record was set by Cyclone Freddy in 2023!
Contents
How ACE Started
The idea for Accumulated Cyclone Energy (ACE) was first developed by William M. Gray and his team at Colorado State University. They called it the Hurricane Destruction Potential (HDP) index. They believed that the damage from a hurricane's winds and storm surge was better linked to the square of its strongest wind speed, not just the wind speed itself.
They calculated this by squaring the strongest wind speed of hurricanes (winds above 65 kn (120 km/h; 75 mph)) every six hours throughout the season. Later, the United States National Oceanic and Atmospheric Administration (NOAA) updated this scale. They decided to include all tropical cyclones, even weaker ones, with winds above 35 kn (65 km/h; 40 mph). NOAA also gave it the new name: accumulated cyclone energy index.
Since then, different weather agencies and researchers use ACE in many ways. For example, they use it to see how busy a tropical cyclone season was. They also use it to spot long-term changes in storm activity in certain areas, like the Lesser Antilles.
How ACE is Calculated
To calculate the Accumulated Cyclone Energy for a season, scientists add up the squares of the strongest wind speeds for every tropical cyclone. They do this for storms that have winds of 35 kn (65 km/h; 40 mph) or higher, checking every six hours.
The total number is usually divided by 10,000. This makes the numbers smaller and easier to work with. One unit of ACE is equal to 10−4 kn2.
Here's the simple formula:
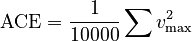
In this formula, vmax is the estimated strongest wind speed of the storm, measured in knots.
Think of it this way: the energy a storm has is related to the square of its speed. By adding up these squared speeds over time, we get the "accumulated" (total collected) energy. This means that storms that last longer can have a higher ACE score, even if they aren't the most powerful at any single moment. ACE isn't a direct measure of the storm's actual energy (because that would also depend on the storm's size), but it's a good way to compare their overall activity.
Atlantic Ocean Storms

In the Atlantic Ocean, the United States National Oceanic and Atmospheric Administration (NOAA) uses the ACE index to put hurricane seasons into different groups. These groups are: extremely active, above-normal, near-normal, and below-normal. They figure this out by looking at ACE values from 1951 to 2020. The middle value (median) for ACE in this period was 96.7 x 10⁴ kt2.
| Category | ACE Index | % of 1951–2020 median |
|||
|---|---|---|---|---|---|
| Extremely active | > 159.6 | > 165% | |||
| Above-normal | > 126.1 | > 130% | |||
| Near-normal | 73–126.1 | 75–130% | |||
| Below-normal | < 73 | < 75% | |||
| Reference: | |||||
| Season | TS | HU | MH | ACE |
|---|---|---|---|---|
| 1933 | 20 | 11 | 6 | 258.57 |
| 2005 | 28 | 15 | 7 | 250.13 |
| 1893 | 12 | 10 | 5 | 231.15 |
| 1926 | 11 | 8 | 6 | 229.56 |
| 1995 | 19 | 11 | 5 | 227.10 |
| 2004 | 15 | 9 | 6 | 226.88 |
| 2017 | 17 | 10 | 6 | 224.88 |
| 1950 | 16 | 11 | 6 | 211.28 |
| 1961 | 12 | 8 | 5 | 205.39 |
| 1998 | 14 | 10 | 3 | 181.76 |
Individual Storms in the Atlantic
The highest ACE ever recorded for a single storm in the Atlantic was 73.6. This was for the San Ciriaco hurricane in 1899. This storm was a Category 4 hurricane and lasted for four weeks! Its ACE was even higher than many entire Atlantic hurricane seasons.
Other Atlantic storms with very high ACE scores include:
- Hurricane Ivan (2004) with 70.4 ACE
- Hurricane Irma (2017) with 64.9 ACE
- The Great Charleston Hurricane (1893) with 63.5 ACE
- Hurricane Isabel (2003) with 63.3 ACE
- The 1932 Cuba hurricane with 59.8 ACE
Since 1950, the tropical storm with the highest ACE was Tropical Storm Laura in 1971, with an ACE of 8.6. The Category 1 hurricane with the highest ACE was Hurricane Nadine in 2012, reaching 26.3 ACE.
Some storms have very low ACE scores. For example, tropical storms Chris (2000) and Philippe (2017) were tropical storms for only six hours and had an ACE of just 0.1. The lowest ACE for any hurricane was Hurricane Cindy (2005) with 1.5175 ACE, and Hurricane Lorenzo (2007) with 1.475 ACE.
The following table shows the Atlantic storms from 1851–2021 that had over 50 points of ACE.
| Storm | Year | Peak classification | ACE | Duration |
|---|---|---|---|---|
| Hurricane Three | 1899 |
|
73.6 | 28 days |
| Hurricane Ivan | 2004 |
|
70.4 | 23 days |
| Hurricane Irma | 2017 |
|
64.9 | 13 days |
| Hurricane Nine | 1893 |
|
63.5 | 20 days |
| Hurricane Isabel | 2003 |
|
63.3 | 14 days |
| Hurricane Fourteen | 1932 |
|
59.8 | 15 days |
| Hurricane Donna | 1960 |
|
57.6 | 16 days |
| Hurricane Carrie | 1957 |
|
55.8 | 21 days |
| Hurricane Inez | 1966 |
|
54.6 | 21 days |
| Hurricane Sam | 2021 |
|
53.8 | 14 days |
| Hurricane Luis | 1995 |
|
53.5 | 16 days |
| Hurricane Allen | 1980 |
|
52.3 | 12 days |
| Hurricane Esther | 1961 |
|
52.2 | 18 days |
| Hurricane Matthew | 2016 |
|
50.9 | 12 days |
Atlantic Hurricane History and ACE
It's harder to count tropical storms and hurricanes accurately before the mid-1960s. This is because satellites weren't used to track storms back then.
Classification criteria Extremely active Above-normal Near-normal Below-normal
Eastern Pacific Storms
In the Eastern Pacific Ocean, the United States National Oceanic and Atmospheric Administration (NOAA) also uses the ACE index. They classify seasons into three groups: above-normal, near-normal, and below-normal. These groups are based on the ACE index and the number of tropical storms, hurricanes, and major hurricanes from 1991 to 2020.
For a season to be called "above-normal," it needs to meet the ACE index rule and at least two more rules from the table below.
The average ACE value for the Eastern Pacific from 1991 to 2020 is 108.7 x 10⁴ kt2. The middle value (median) is 97.2 x 10⁴ kt2.
| Category | ACE Index | % of 1991–2020 median |
Tropical storms |
Hurricanes | Major hurricanes |
|---|---|---|---|---|---|
| Above-normal | > 115 | > 120% | 17 or more | 9 or more | 5 or more |
| Near-normal | 80–115 | 80–120% | 16 or fewer | 8 or fewer | 4 or fewer |
| Below-normal | < 80 | < 80% | N/A | ||
| Reference: | |||||
| Season | TS | HU | MH | ACE |
|---|---|---|---|---|
| 2018 | 23 | 13 | 10 | 318 |
| 1992 | 27 | 16 | 10 | 295 |
| 2015 | 26 | 16 | 11 | 287 |
| 1990 | 21 | 16 | 6 | 245 |
| 1978 | 19 | 14 | 7 | 207 |
| 1983 | 21 | 12 | 8 | 206 |
| 1993 | 15 | 11 | 9 | 201 |
| 2014 | 22 | 16 | 9 | 199 |
| 1984 | 21 | 13 | 7 | 193 |
| 1985 | 24 | 13 | 8 | 192 |
Individual Storms in the Pacific
The highest ACE ever recorded for a single storm in the Eastern or Central Pacific (east of the International Date Line) is 62.8. This was for Hurricane Fico in 1978.
Other Eastern Pacific storms with high ACE scores include:
- Hurricane John (1994) with 54.0 ACE
- Hurricane Kevin (1991) with 52.1 ACE
- Hurricane Hector (2018) with 50.5 ACE
The table below shows storms in the Eastern and Central Pacific from 1971–2018 that had over 30 points of ACE.
| Storm | Year | Peak classification | ACE | Duration |
|---|---|---|---|---|
| Hurricane Fico | 1978 |
|
62.8 | 20 days |
| Hurricane John |
1994 |
|
54.0 | 19 days |
| Hurricane Kevin | 1991 |
|
52.1 | 17 days |
| Hurricane Hector |
2018 |
|
50.5 | 13 days |
| Hurricane Tina | 1992 |
|
47.7 | 22 days |
| Hurricane Trudy | 1990 |
|
45.8 | 16 days |
| Hurricane Lane | 2018 |
|
44.2 | 13 days |
| Hurricane Dora |
1999 |
|
41.4 | 13 days |
| Hurricane Jimena | 2015 |
|
40.0 | 15 days |
| Hurricane Guillermo | 1997 |
|
40.0 | 16 days |
| Hurricane Norbert | 1984 |
|
39.6 | 12 days |
| Hurricane Norman | 2018 |
|
36.6 | 12 days |
| Hurricane Celeste | 1972 |
|
36.3 | 16 days |
| Hurricane Sergio | 2018 |
|
35.5 | 13 days |
| Hurricane Lester | 2016 |
|
35.4 | 14 days |
| Hurricane Olaf | 2015 |
|
34.6 | 12 days |
| Hurricane Jimena | 1991 |
|
34.5 | 12 days |
| Hurricane Doreen | 1973 |
|
34.3 | 16 days |
| Hurricane Ioke |
2006 |
|
34.2 | 7 days |
| Hurricane Marie | 1990 |
|
33.1 | 14 days |
| Hurricane Orlene | 1992 |
|
32.4 | 12 days |
| Hurricane Greg | 1993 |
|
32.3 | 13 days |
| Hurricane Hilary | 2011 |
|
31.2 | 9 days |
![]() – This means the storm started in the Eastern/Central Pacific but crossed the 180°W line at least once. So, only the ACE and days spent in the Eastern/Central Pacific are counted.
– This means the storm started in the Eastern/Central Pacific but crossed the 180°W line at least once. So, only the ACE and days spent in the Eastern/Central Pacific are counted.
Eastern Pacific Hurricane History and ACE


We have reliable ACE data for the Eastern Pacific starting from the 1971 season.
Classification criteria Above-normal Near-normal Below-normal
North Indian Ocean Storms
In the North Indian Ocean, several groups track and predict tropical cyclones. These include the United States Joint Typhoon Warning Center and the weather departments of Bangladesh, Pakistan, and India. Because they all track storms a little differently, the ACE values can vary.
However, the India Meteorological Department is the official group for this region, as chosen by the World Meteorological Organization (WMO). They have calculated the ACE for all storm systems with winds above 17 knots (31 km/h; 20 mph). Their records go back to 1982.
| Season | D | DD | CS | SCS | VSCS | ESCS | SUCS | ACE |
|---|---|---|---|---|---|---|---|---|
| 2019 | 12 | 11 | 8 | 6 | 6 | 3 | 1 | 77.95 |
| 1989 | 10 | 6 | 3 | 2 | 1 | 1 | 1 | 45.54 |
| 2023 | 3 | 2 | 2 | 2 | 2 | 2 | 0 | 40.4 |
| 2013 | 10 | 6 | 5 | 4 | 3 | 1 | 0 | 38.87 |
| 2018 | 14 | 9 | 7 | 5 | 3 | 1 | 0 | 35.61 |
| 2015 | 12 | 9 | 4 | 2 | 2 | 2 | 0 | 33.92 |
| 1999 | 10 | 8 | 5 | 3 | 3 | 2 | 1 | 33.60 |
| 2007 | 11 | 8 | 4 | 2 | 2 | 2 | 1 | 32.74 |
| 2020 | 9 | 8 | 5 | 4 | 3 | 1 | 1 | 30.90 |
| 1982 | 19 | 11 | 8 | 5 | 4 | 3 | 0 | 30.04 |
| References: | ||||||||
See Also
 In Spanish: Energía Ciclónica Acumulada para niños
- Atlantic hurricane
- Cyclone Freddy - This storm had the highest accumulated cyclone energy ever recorded worldwide.
- Saffir–Simpson scale - Another way to measure how strong a storm is.
