
Atlantic hurricane season facts for kids

The Atlantic hurricane season is a special time of year when tropical storms and hurricanes are most likely to form in the North Atlantic Ocean. This period officially runs from June 1 to November 30. Even though these dates are set, tropical storms can sometimes form at other times of the year!
Hurricanes usually happen most often in late summer. This is when the ocean water is warmest, and the air temperature is very different from the sea. In the Atlantic, the busiest time for hurricanes is from late August through September, with the peak day being September 10.
When Atlantic tropical storms and hurricanes get strong enough, they are given names from a special list. On average, about 14 named storms happen each season. Out of these, about 7 become hurricanes, and 3 become "major hurricanes." A major hurricane is a very strong storm, Category 3 or higher on the Saffir–Simpson scale.
The busiest season ever was in 2020, with 30 named tropical cyclones. However, the 2005 season had more hurricanes, with a record of 15. The quietest season was 1914, with only one known tropical storm.
Contents
What is the Atlantic Hurricane Season?
People have known for a long time that hurricanes in the Atlantic Ocean happen mostly during certain months. Early sailors and explorers noticed this pattern. For example, in the 1700s, William Dampier, an English explorer, wrote that hurricanes in the Caribbean Sea were expected in July, August, and September.
How the Season Was First Understood
Understanding the hurricane season was very important for ships and trade. Navies in the 18th century knew they had to move their supplies quickly before the "hurricane season" started.
Over time, different people defined the season slightly differently. An American meteorologist named William Charles Redfield said the season lasted from July 15 to October 15. He even noted that some insurance companies raised their prices during this time because of the higher chance of hurricanes.
When the Official Season Began
The idea of an "official" hurricane season really started in 1935. This is when special communication lines, called hurricane circuits, were set up along the Gulf and Atlantic coasts. These lines helped track storms. At first, the season was from June 15 to October 31.
Later, the start date was moved to June 1, and the end date was moved to November 30 by 1965. This is the official Atlantic hurricane season we use today. These dates cover more than 97% of all Atlantic tropical storm activity.
Even though the dates are set, storms sometimes form outside of this official period. Because of this, the National Hurricane Center (NHC) started issuing their regular weather outlooks earlier, on May 15, starting in 2021. They are also looking into whether the official start date should be moved earlier.
How Hurricanes Are Tracked
During the hurricane season, the National Hurricane Center (NHC) regularly publishes a "Tropical Weather Outlook." This report points out areas in the tropics where new tropical storms might form. If a storm happens outside the official season, they will still issue special outlooks.
The NHC works closely with the Weather Prediction Center every day to track potential storms. They use special maps to show where storms might be in the next few days.
The HURDAT Database
The North Atlantic hurricane database, called HURDAT, is a huge collection of information about all tropical storms and hurricanes in the Atlantic Ocean, Gulf of Mexico, and Caribbean Sea. This includes storms that have hit the United States.
This database was first created in the 1960s to help predict where storms would go. Today, it's used for many things, like studying climate change, predicting future seasons, and helping emergency managers prepare for storms. It also helps insurance companies understand potential losses.
HURDAT is a very useful tool, but it's important to remember that it wasn't designed for every possible use. It might have some small errors or biases because our understanding of tropical storms has grown over the years.
A Look at Past Seasons
Here's a quick look at some past Atlantic hurricane seasons, showing how many tropical storms (TS), hurricanes (H), and major hurricanes (MH) occurred. "Damage" is shown in US dollars from that time.
1850s to 1900s
| Year | TS | H | MH | Deaths | Damage (USD) |
|---|---|---|---|---|---|
| 1851 | 6 | 3 | 1 | 24 | Unknown |
| 1852 | 5 | 5 | 1 | 100+ | Unknown |
| 1853 | 8 | 4 | 2 | 40 | Unknown |
| 1854 | 5 | 3 | 1 | 30+ | Unknown |
| 1855 | 5 | 4 | 1 | Unknown | Unknown |
| 1856 | 6 | 4 | 2 | 200+ | Unknown |
| 1857 | 4 | 3 | 0 | 424 | Unknown |
| 1858 | 6 | 6 | 0 | None | Unknown |
| 1859 | 8 | 7 | 1 | Numerous | Unknown |
| 1860 | 7 | 6 | 1 | 60+ | Unknown |
| 1861 | 8 | 6 | 0 | 22+ | Unknown |
| 1862 | 6 | 3 | 0 | 3 | Unknown |
| 1863 | 9 | 5 | 0 | 90 | Unknown |
| 1864 | 5 | 3 | 0 | None | Unknown |
| 1865 | 7 | 3 | 0 | 326 | Unknown |
| 1866 | 7 | 6 | 1 | 383 | Unknown |
| 1867 | 9 | 7 | 1 | 811 | Unknown |
| 1868 | 4 | 3 | 0 | 2 | Unknown |
| 1869 | 10 | 7 | 1 | 38 | Unknown |
| 1870 | 11 | 10 | 2 | 2,052 | Unknown |
| 1871 | 8 | 6 | 2 | 30 | Unknown |
| 1872 | 5 | 4 | 0 | Unknown | Unknown |
| 1873 | 5 | 3 | 2 | 626 | Unknown |
| 1874 | 7 | 4 | 0 | Unknown | Unknown |
| 1875 | 6 | 5 | 1 | 800 | Unknown |
| 1876 | 5 | 4 | 2 | 19 | Unknown |
| 1877 | 8 | 3 | 1 | 34 | Unknown |
| 1878 | 12 | 10 | 2 | 108 | Unknown |
| 1879 | 8 | 6 | 2 | 47 | Unknown |
| 1880 | 11 | 9 | 2 | 133 | Unknown |
| 1881 | 7 | 4 | 0 | 700 | Unknown |
| 1882 | 6 | 4 | 2 | 6 | Unknown |
| 1883 | 4 | 3 | 2 | 236 | Unknown |
| 1884 | 4 | 4 | 1 | 8 | Unknown |
| 1885 | 8 | 6 | 0 | 25 | Unknown |
| 1886 | 12 | 10 | 4 | 200+ | Unknown |
| 1887 | 19 | 11 | 2 | 2 | Unknown |
| 1888 | 9 | 6 | 2 | 924 | Unknown |
| 1889 | 9 | 6 | 0 | 40 | Unknown |
| 1890 | 4 | 2 | 1 | 14 | Unknown |
| 1891 | 10 | 7 | 1 | 700+ | Unknown |
| 1892 | 9 | 5 | 0 | 16 | Unknown |
| 1893 | 12 | 10 | 5 | 4,028 | Unknown |
| 1894 | 7 | 5 | 4 | 200+ | Unknown |
| 1895 | 6 | 2 | 0 | 56 | Unknown |
| 1896 | 7 | 6 | 2 | 286 | Unknown |
| 1897 | 6 | 3 | 0 | 262 | Unknown |
| 1898 | 11 | 5 | 1 | 562 | Unknown |
| 1899 | 10 | 5 | 2 | 4,167 | Unknown |
| 1900 | 7 | 3 | 2 | 8,000+ | $35.4M |
1900s to 1950s
| Year | TS | H | MH | Deaths | Damage (USD) |
|---|---|---|---|---|---|
| 1901 | 13 | 6 | 0 | 35-40 | $1M |
| 1902 | 5 | 3 | 0 | 5 | Unknown |
| 1903 | 10 | 7 | 1 | 222 | $18.5M |
| 1904 | 6 | 4 | 0 | 112 | $2.5M |
| 1905 | 5 | 1 | 1 | 8 | Unknown |
| 1906 | 11 | 6 | 3 | 381 | $25.4M |
| 1907 | 5 | 0 | 0 | None | Unknown |
| 1908 | 10 | 6 | 1 | 37 | Unknown |
| 1909 | 12 | 6 | 4 | 4,673 | $77.3M |
| 1910 | 5 | 3 | 1 | 100 | $1.25M |
| 1911 | 6 | 3 | 0 | 27 | $3M |
| 1912 | 7 | 4 | 1 | 116 | $1.6M |
| 1913 | 6 | 4 | 0 | 5 | $4M |
| 1914 | 1 | 0 | 0 | 0 | Unknown |
| 1915 | 6 | 5 | 3 | 675 | $63M |
| 1916 | 15 | 10 | 5 | 31 | $5.9M |
| 1917 | 4 | 2 | 2 | 76 | $170,000 |
| 1918 | 6 | 4 | 1 | 55 | $5M |
| 1919 | 5 | 2 | 1 | 828 | $22M |
| 1920 | 5 | 4 | 0 | 1 | $1.5M |
| 1921 | 7 | 5 | 2 | 6 | $36.5M |
| 1922 | 5 | 3 | 1 | 105 | $2.3M |
| 1923 | 9 | 4 | 1 | 15 | $1.3M |
| 1924 | 11 | 5 | 2 | 179 | Unknown |
| 1925 | 4 | 1 | 0 | 59+ | $19.9M |
| 1926 | 11 | 8 | 6 | 1,448 | $247.4M |
| 1927 | 8 | 4 | 1 | 184 | Unknown |
| 1928 | 6 | 4 | 1 | 4,289 | $102M |
| 1929 | 5 | 3 | 1 | 62 | $10.0M |
| 1930 | 3 | 2 | 2 | 8,000 | $50M |
| 1931 | 13 | 3 | 1 | 2,502 | $7.5M |
| 1932 | 15 | 6 | 4 | 3,315 | $37M |
| 1933 | 20 | 11 | 6 | 651 | $86.6M |
| 1934 | 13 | 7 | 1 | 2,017 | $4.26M |
| 1935 | 8 | 5 | 3 | 2,604 | $12.5M |
| 1936 | 17 | 7 | 1 | 5 | $1.23M |
| 1937 | 11 | 4 | 1 | 0 | Unknown |
| 1938 | 9 | 4 | 2 | ~700 | $290.3M |
| 1939 | 6 | 3 | 1 | 5 | Unknown |
| 1940 | 9 | 6 | 0 | 101 | $4.7M |
| 1941 | 6 | 4 | 3 | 63 | $10M |
| 1942 | 11 | 4 | 1 | 17 | $30.6M |
| 1943 | 10 | 5 | 2 | 19 | $17.2M |
| 1944 | 14 | 8 | 3 | 1,153 | $202M |
| 1945 | 11 | 5 | 2 | 80 | $80M |
| 1946 | 7 | 3 | 0 | 5 | $5.2M |
| 1947 | 10 | 5 | 2 | 94 | $145.3M |
| 1948 | 10 | 6 | 4 | 94 | $30.9M |
| 1949 | 16 | 7 | 3 | 3 | $58.2M |
| 1950 | 16 | 11 | 6 | 20 | $37M |
| 1951 | 12 | 8 | 3 | 257 | $80M |
| 1952 | 11 | 5 | 2 | 607 | $3.75M |
| 1953 | 14 | 7 | 3 | 1 | $6M |
| 1954 | 16 | 7 | 3 | 1,069 | $752M |
| 1955 | 13 | 9 | 4 | 1,518 | $1.2bn |
| 1956 | 12 | 4 | 1 | 76 | $67.8M |
| 1957 | 8 | 3 | 2 | 513 | $152.5M |
| 1958 | 12 | 7 | 3 | 41 | $12M |
| 1959 | 14 | 7 | 2 | 59 | $23.3M |
1960s to 2020s
| Year | TS | H | MH | Deaths | Damage (USD) | Retired names |
|---|---|---|---|---|---|---|
| 1960 | 8 | 4 | 2 | 455 | $442.34M | 4 Donna |
| 1961 | 12 | 8 | 5 | 345 | $392M | 4 Carla 5 Hattie |
| 1962 | 7 | 4 | 0 | 39 | >$4.88M | None |
| 1963 | 10 | 7 | 3 | 7,225 | $589M | 4 Flora |
| 1964 | 13 | 7 | 5 | 261 | $605M | 4 Cleo 4 Dora 4 Hilda |
| 1965 | 10 | 4 | 1 | 76 | $1.45bn | 4 Betsy |
| 1966 | 15 | 7 | 3 | 1,094 | $410M | 5 Inez |
| 1967 | 15 | 6 | 1 | 64 | $217M | 5 Beulah |
| 1968 | 8 | 5 | 0 | 10 | $10M | None |
| 1969 | 18 | 12 | 3 | 364 | $1.7bn | 5 Camille |
| 1970 | 14 | 7 | 2 | 71 | $454M | 4 Celia |
| 1971 | 13 | 6 | 1 | 45 | $213M | None |
| 1972 | 7 | 3 | 0 | 122 | $2.1bn | 1 Agnes |
| 1973 | 8 | 4 | 1 | 15 | $18M | None |
| 1974 | 11 | 4 | 2 | 8,260+ | $1.97bn | 4 Carmen 2 Fifi |
| 1975 | 9 | 6 | 3 | 80 | $100M | 3 Eloise |
| 1976 | 10 | 6 | 2 | 72 | $100M | None |
| 1977 | 6 | 5 | 1 | 10 | $10M | 5 Anita |
| 1978 | 12 | 5 | 2 | 37 | $45M | 4 Greta |
| 1979 | 9 | 6 | 2 | 2,118 | $4.3bn | 5 David 4 Frederic |
| 1980 | 11 | 9 | 2 | 256 | $1bn | 5 Allen |
| 1981 | 12 | 7 | 3 | 10 | $45M | None |
| 1982 | 6 | 2 | 1 | 141 | $100M | None |
| 1983 | 4 | 3 | 1 | 22 | $2.6bn | 3 Alicia |
| 1984 | 13 | 5 | 1 | 35 | $66M | None |
| 1985 | 11 | 7 | 3 | 241 | $4.5bn | 3 Elena 4 Gloria |
| 1986 | 6 | 4 | 0 | 70 | $57M | None |
| 1987 | 7 | 3 | 1 | 10 | $90M | None |
| 1988 | 12 | 5 | 3 | 550 | $7bn | 5 Gilbert 4 Joan |
| 1989 | 11 | 7 | 2 | 112 | $10.7bn | 5 Hugo |
| 1990 | 14 | 8 | 1 | 116 | $150M | 2 Diana 1 Klaus |
| 1991 | 8 | 4 | 2 | 30 | $2.5bn | 3 Bob |
| 1992 | 7 | 4 | 1 | 66 | $27bn | 5 Andrew |
| 1993 | 8 | 4 | 1 | 274 | $271M | None |
| 1994 | 7 | 3 | 0 | 1,184 | $1.56bn | None |
| 1995 | 19 | 11 | 5 | 115 | $9.3bn | 4 Luis 3 Marilyn 4 Opal 3 Roxanne |
| 1996 | 13 | 9 | 6 | 179 | $3.8bn | 1 Cesar 3 Fran 4 Hortense |
| 1997 | 8 | 3 | 1 | 11 | $110M | None |
| 1998 | 14 | 10 | 3 | 12,000+ | $12.2bn | 4 Georges 5 Mitch |
| 1999 | 12 | 8 | 5 | 465 | $5.9bn | 4 Floyd 4 Lenny |
| 2000 | 15 | 8 | 3 | 105 | $1.3bn | 4 Keith |
| 2001 | 15 | 9 | 4 | 153 | $11.4bn | TS Allison 4 Iris 4 Michelle |
| 2002 | 12 | 4 | 2 | 50 | $2.5bn | 3 Isidore 4 Lili |
| 2003 | 16 | 7 | 3 | 93 | $6.3bn | 4 Fabian 5 Isabel 2 Juan |
| 2004 | 15 | 9 | 6 | 3,260 | $61.2bn | 4 Charley 4 Frances 5 Ivan 3 Jeanne |
| 2005 | 28 | 15 | 7 | 3,912 | $171.8bn | 4 Dennis 5 Katrina 5 Rita 1 Stan 5 Wilma |
| 2006 | 10 | 5 | 2 | 14 | $504.4M | None |
| 2007 | 15 | 6 | 2 | 478 | $3.4bn | 5 Dean 5 Felix 1 Noel |
| 2008 | 16 | 8 | 5 | 1,073 | $49.4bn | 4 Gustav 4 Ike 4 Paloma |
| 2009 | 9 | 3 | 2 | 9 | $58M | None |
| 2010 | 19 | 12 | 5 | 393 | $7.4bn | 4 Igor 2 Tomas |
| 2011 | 19 | 7 | 4 | 112 | $17.4bn | 3 Irene |
| 2012 | 19 | 10 | 2 | 355 | $72.3bn | 3 Sandy |
| 2013 | 14 | 2 | 0 | 54 | $1.5bn | 1 Ingrid |
| 2014 | 8 | 6 | 2 | 21 | $371.6M | None |
| 2015 | 11 | 4 | 2 | 89 | $813.9M | TS Erika 4 Joaquin |
| 2016 | 15 | 7 | 4 | 736 | ≥$17.5bn | 5 Matthew 3 Otto |
| 2017 | 17 | 10 | 6 | 3,364 | ≥$294.7bn | 4 Harvey 5 Irma 5 Maria 1 Nate |
| 2018 | 15 | 8 | 2 | 172 | ≥$50.5bn | 4 Florence 5 Michael |
| 2019 | 18 | 6 | 3 | 118 | $11.6bn | 5 Dorian |
| 2020 | 30 | 14 | 7 | ≥417 | >$55.4bn | 4 Laura 4 Eta 4 Iota |
| 2021 | 21 | 7 | 4 | 194 | $80.7bn | 4 Ida |
| 2022 | 14 | 8 | 2 | 304 | >$117.7bn | 4 Fiona 5 Ian |
| 2023 | 20 | 7 | 3 | 20 | >$4.2bn | None |
| 2024 | 5 | 2 | 1 | 85 | >$9.9bn | TBD |
Number of Storms Each Year
This chart shows how many tropical storms and hurricanes have formed each year in the Atlantic.

Scientists have found that changes in African easterly waves (AEWs) are linked to more strong hurricanes in the North Atlantic. AEWs are weather patterns that can help tropical storms form.


Images for kids
-

This painting shows a ship caught in a hurricane in 1780. Knowing the hurricane season was very important for sailors.
-
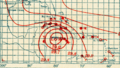
This old weather map from 1915 shows how the U.S. Weather Bureau used to track hurricanes.
-
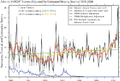
This graph shows the number of tropical storms, adjusted for how well we could observe them before 1965.


See also
 In Spanish: Temporada de huracanes en el Atlántico para niños
- Accumulated cyclone energy
- List of Atlantic hurricane records
- List of environment topics
- Outline of tropical cyclones
- Pacific hurricane season
- Pacific typhoon season
- North Indian Ocean tropical cyclone season
- South-West Indian Ocean tropical cyclone season
- Australian region tropical cyclone season
- South Pacific tropical cyclone season
- South Atlantic tropical cyclone
- Mediterranean tropical-like cyclone
