
Alpine County, California facts for kids
Quick facts for kids
Alpine County, California
|
|||
|---|---|---|---|
| Alpine County |
|||
 .jpg)  Images, from top down, left to right: an Alpine County line road sign during a snowstorm, Alpine County Courthouse, a view eastward from Carson Pass overlooking Red Lake
|
|||
|
|||

Location in the state of California
|
|||
| Country | |||
| State | |||
| Region | Sierra Nevada | ||
| Incorporated | March 16, 1864 | ||
| Named for | Its location in the Sierra Nevada resembling the (Swiss) Alps | ||
| County seat | Markleeville | ||
| Largest community | Markleeville | ||
| Government | |||
| • Type | Council–CAO | ||
| • Body |
Board of Supervisors
Charles Dobson
Ron Hames Irvin Jim Terry Woodrow David Griffith |
||
| Area | |||
| • Total | 743 sq mi (1,920 km2) | ||
| • Land | 738 sq mi (1,910 km2) | ||
| • Water | 4.8 sq mi (12 km2) | ||
| Highest elevation | 11,464 ft (3,494 m) | ||
| Population
(2020)
|
|||
| • Total | 1,204 | ||
| • Density | 1.6205/sq mi (0.6257/km2) | ||
| GDP | |||
| • Total | $0.117 billion (2022) | ||
| Time zone | UTC−8 (Pacific Standard Time) | ||
| • Summer (DST) | UTC−7 (Pacific Daylight Time) | ||
| Area codes | 209, 530 | ||
| Congressional district | 3rd | ||
| GNIS feature ID | 1675840 | ||


Alpine County is a county in the eastern part of California. It's located in the Sierra Nevada mountains, right on the border with Nevada. In 2020, only 1,204 people lived there. This makes it California's least populated county. The main town and county seat is Markleeville.
Contents
History of Alpine County

The Washoe people, a Native American tribe, lived in this area for a very long time. They lived along the California-Nevada border in the Sierra Nevada mountains.
Early explorers like Kit Carson and John C. Frémont visited the Sierra Nevada in the 1840s. They helped bring attention to the region. The first known Western explorers were Jedediah Smith and Joseph R. Walker.
Alpine County grew because of mining. While gold was important, the discovery of silver nearby in Nevada (the Comstock Lode) really boosted the county. Many miners came from Nevada to find silver here.
Alpine County was officially formed on March 16, 1864. It was created from parts of several other counties. It was named "Alpine" because its mountains looked a lot like the Swiss Alps. When it was first formed, about 11,000 people lived there.
However, the silver mines in Alpine County didn't produce much silver. By 1868, the population dropped sharply to about 685 people. This decline continued for many years. Silver Mountain was the first county seat. But in 1875, Markleeville became the new county seat. The silver industry collapsed, and Silver Mountain was abandoned by 1886. Most businesses moved to Markleeville.
The population kept falling until the 1950s, reaching a low of 241 people in 1930. During this time, the county's economy relied on farming, lumber, fishing, and hunting.
Alpine County's economy finally got better in the late 1960s. This happened when the Bear Valley and Kirkwood ski resorts were built. The population then jumped from 484 in 1970 to 1,097 in 1980. It has stayed around that number since then.
Most of Alpine County (about 96%) is owned by the U.S. government. This includes three national forests: Eldorado, Humboldt–Toiyabe, and Stanislaus. These forests offer great opportunities for tourism, like skiing and outdoor activities.
Geography of Alpine County
Alpine County covers about 743 square miles. Most of this (738 square miles) is land, and a small part (4.8 square miles) is water. As mentioned, the U.S. government owns about 96% of the county. This is the highest percentage of federal land in any California county. It includes parts of the Eldorado, Stanislaus, and Humboldt–Toiyabe National Forests.
Counties Nearby
- El Dorado County – to the northwest
- Douglas County, Nevada – to the northeast
- Mono County – to the southeast
- Tuolumne County – to the south
- Calaveras County – to the southwest
- Amador County – to the west
Protected Areas
- Eldorado National Forest (part)
- Stanislaus National Forest (part)
- Toiyabe National Forest (part)
People of Alpine County (Demographics)
| Historical population | |||
|---|---|---|---|
| Census | Pop. | %± | |
| 1870 | 685 | — | |
| 1880 | 539 | −21.3% | |
| 1890 | 667 | 23.7% | |
| 1900 | 509 | −23.7% | |
| 1910 | 309 | −39.3% | |
| 1920 | 243 | −21.4% | |
| 1930 | 241 | −0.8% | |
| 1940 | 323 | 34.0% | |
| 1950 | 241 | −25.4% | |
| 1960 | 397 | 64.7% | |
| 1970 | 484 | 21.9% | |
| 1980 | 1,097 | 126.7% | |
| 1990 | 1,113 | 1.5% | |
| 2000 | 1,208 | 8.5% | |
| 2010 | 1,175 | −2.7% | |
| 2020 | 1,204 | 2.5% | |
| 2023 (est.) | 1,141 | −2.9% | |
| U.S. Decennial Census 1790–1960 1900–1990 1990–2000 2010 2020 |
|||
In 2020, Alpine County had a population of 1,204 people.
- About 66.5% of the people were White.
- About 17.8% were Native American.
- About 6.3% were of two or more races.
- About 7% of the population was Hispanic or Latino.
In 2010, the county had 1,175 people. Most people (75%) were White, and about 20.4% were Native American.
Transportation
Main Roads
 State Route 4
 State Route 88
 State Route 89
Airport
The Alpine County Airport is a small airport. It's about 4 miles from Markleeville. It has a simple runway for small planes. There are no buildings or lights, and it's not used very often. People who like to look at stars enjoy this airport because the skies are very clear and dark.
Communities in Alpine County

All the towns and areas in Alpine County are "unincorporated." This means they don't have their own city government. Instead, the county government handles everything.
- Alpine Village
- Bear Valley
- Fredericksburg
- Kirkwood
- Lake Alpine
- Loope
- Markleeville (This is the county seat!)
- Mesa Vista
- Paynesville
- Sorensens
- Woodfords
Alpine County is one of only three counties in California that doesn't have any official cities. The other two are Mariposa and Trinity.
Biggest Communities (2020 Census)
Here are the communities in Alpine County, ranked by how many people live there:
| Rank | Community Name | Type | Population (2020 census) |
|---|---|---|---|
| 1 | Woodfords Community | Native American Area | 225 |
| 2 | Alpine Village | Census-designated place (CDP) | 224 |
| 3 | Mesa Vista | Census-designated place (CDP) | 217 |
| 4 | † Markleeville | Census-designated place (CDP) | 191 |
| 5 | Kirkwood (partially in Amador County) | Census-designated place (CDP) | 190 |
| 6 | Bear Valley | Census-designated place (CDP) | 128 |
† county seat
Images for kids
-
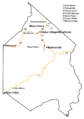
A map showing the different communities in Alpine County.
See also
 In Spanish: Condado de Alpine para niños
