Chester County, South Carolina facts for kids
Quick facts for kids
Chester County
|
||
|---|---|---|

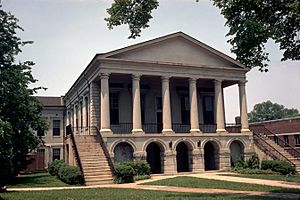
Chester County Courthouse
|
||
|
||
| Motto(s):
"Choose Chester County, For Business. For Life."
|
||

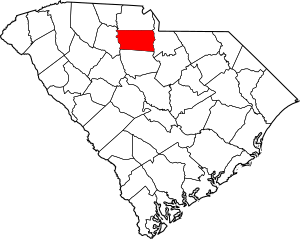
Location within the U.S. state of South Carolina
|
||
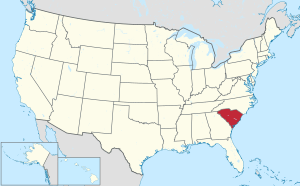
 South Carolina's location within the U.S. |
||
| Country | ||
| State | ||
| Founded | 1785 | |
| Named for | Chester, Pennsylvania (Chester, England) | |
| Seat | Chester | |
| Largest community | Chester | |
| Area | ||
| • Total | 586.16 sq mi (1,518.1 km2) | |
| • Land | 580.66 sq mi (1,503.9 km2) | |
| • Water | 5.50 sq mi (14.2 km2) 0.94% | |
| Population
(2020)
|
||
| • Total | 32,294 | |
| • Estimate
(2023)
|
32,226 | |
| • Density | 55.62/sq mi (21.48/km2) | |
| Time zone | UTC−5 (Eastern) | |
| • Summer (DST) | UTC−4 (EDT) | |
| Congressional district | 5th | |
Chester County is a special area called a county in the state of South Carolina. It's located in the southeastern part of the United States. In 2020, about 32,294 people lived there. The main town and center of the county is called Chester.
Chester County is also part of a larger area called the Charlotte Metropolitan Statistical Area. This means it's connected to bigger cities like Charlotte, Concord, and Gastonia in North Carolina and South Carolina.
Contents
History of Chester County
Chester County was officially started in 1785. It was named after a town called Chester, Pennsylvania, which itself was named after Chester in England. The town of Chester is the biggest community and the main hub for the county.
Exploring Chester County's Geography
Geography is all about the land, water, and features of a place. Chester County covers a total area of about 586 square miles. Most of this area, about 580 square miles, is land. The rest, about 5.5 square miles, is water.
Protected Natural Areas
Chester County is home to some important natural spaces that are protected. These areas help keep nature safe and offer places for people to enjoy the outdoors.
- Sumter National Forest (a part of this large forest is in Chester County)
- Chester State Park
- Landsford Canal Forest Legacy Area
- Landsford Canal State Park
- Woods Ferry Recreation Area
Major Rivers and Lakes
Many important rivers and lakes flow through or are located in Chester County. These water bodies are important for wildlife and for people.
- Broad River
- Catawba River
- Chester Reservoir
- Great Falls Lake
- Fishing Creek Lake
Neighboring Counties
Chester County shares its borders with several other counties:
- To the north: York County
- To the east: Lancaster County
- To the south: Fairfield County
- To the west: Union County
Main Roads and Highways
Several major highways and roads pass through Chester County. These roads help people travel around the county and connect to other parts of South Carolina and beyond.
 I-77
I-77 US 21
US 21 US 321


 US 321 Bus.
 SC 9
SC 9


 SC 9 Bus.
 SC 49
SC 49 SC 72
SC 72 SC 97
SC 97 SC 99
SC 99 SC 121
 SC 215
 SC 223
 SC 901
 SC 909
People of Chester County (Demographics)
| Historical population | |||
|---|---|---|---|
| Census | Pop. | %± | |
| 1790 | 6,866 | — | |
| 1800 | 8,185 | 19.2% | |
| 1810 | 11,479 | 40.2% | |
| 1820 | 14,189 | 23.6% | |
| 1830 | 17,182 | 21.1% | |
| 1840 | 17,747 | 3.3% | |
| 1850 | 18,038 | 1.6% | |
| 1860 | 18,122 | 0.5% | |
| 1870 | 18,805 | 3.8% | |
| 1880 | 24,153 | 28.4% | |
| 1890 | 26,660 | 10.4% | |
| 1900 | 28,616 | 7.3% | |
| 1910 | 29,425 | 2.8% | |
| 1920 | 33,389 | 13.5% | |
| 1930 | 31,803 | −4.8% | |
| 1940 | 32,579 | 2.4% | |
| 1950 | 32,597 | 0.1% | |
| 1960 | 30,888 | −5.2% | |
| 1970 | 29,811 | −3.5% | |
| 1980 | 30,148 | 1.1% | |
| 1990 | 32,170 | 6.7% | |
| 2000 | 34,068 | 5.9% | |
| 2010 | 33,140 | −2.7% | |
| 2020 | 32,294 | −2.6% | |
| 2023 (est.) | 32,226 | −2.8% | |
| U.S. Decennial Census 1790–1960 1900–1990 1990–2000 2010 2020 |
|||
Demographics is the study of people in a certain area. This includes how many people live there and what groups they belong to.
2020 Census Information
The 2020 census counted 32,294 people living in Chester County. There were 12,653 households and 8,042 families.
Here's a look at the different groups of people living in Chester County in 2020:
| Race | Num. | Perc. |
|---|---|---|
| White (non-Hispanic) | 18,591 | 57.57% |
| Black or African American (non-Hispanic) | 11,287 | 34.95% |
| Native American | 145 | 0.45% |
| Asian | 146 | 0.45% |
| Pacific Islander | 14 | 0.04% |
| Other/Mixed | 1,316 | 4.08% |
| Hispanic or Latino | 795 | 2.46% |
Chester County's Economy
The economy of a place is how people make and spend money. Chester County's economy is based on both industry (factories and businesses) and agriculture (farming).
Many areas are used for growing timber (trees for wood). There are also several sawmills that process this wood. Farmers in the county grow crops like cotton, wheat, and corn. They also raise animals like beef and dairy cattle. Peaches, other vegetables, peanuts, soybeans, and pecans are also grown here.
In 2022, the total value of all goods and services produced in Chester County was about $1.4 billion. This is called the Gross Domestic Product (GDP). The unemployment rate, which is the percentage of people looking for jobs who can't find them, changed between 3.1% and 5.6% from 2022 to 2024.
As of April 2024, some of the biggest employers in Chester County include the Chester County School District, E & J Gallo Winery, and Walmart. These businesses provide many jobs for the people living in the county.
Local Media
Chester County has its own ways for people to get news and entertainment.
- Chester Vision or CSN (a local TV channel)
- Chester News & Reporter (a local newspaper)
- WRBK, 90.3 FM (a local radio station that plays classic oldies music)
Communities in Chester County
Chester County has different types of communities, from a main city to smaller towns and unincorporated areas.
City
- Chester (This is the county seat and the largest community.)
Towns
Census-designated places
These are areas that are like towns but are not officially incorporated as cities or towns.
- Eureka Mill
- Gayle Mill
Unincorporated communities
These are smaller communities that are not part of any city or town.
Notable People from Chester County
- John Adair, (1757–1840), was born in Chester County. He became a member of the United States House of Representatives and the United States Senate. He also served as the 8th governor of Kentucky.
See also
 In Spanish: Condado de Chester (Carolina del Sur) para niños
 | Stephanie Wilson |
 | Charles Bolden |
 | Ronald McNair |
 | Frederick D. Gregory |


