Community areas in Chicago facts for kids
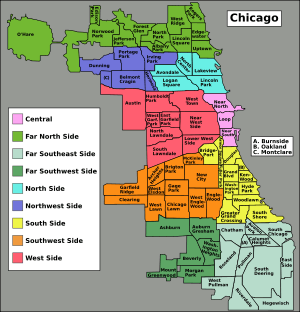
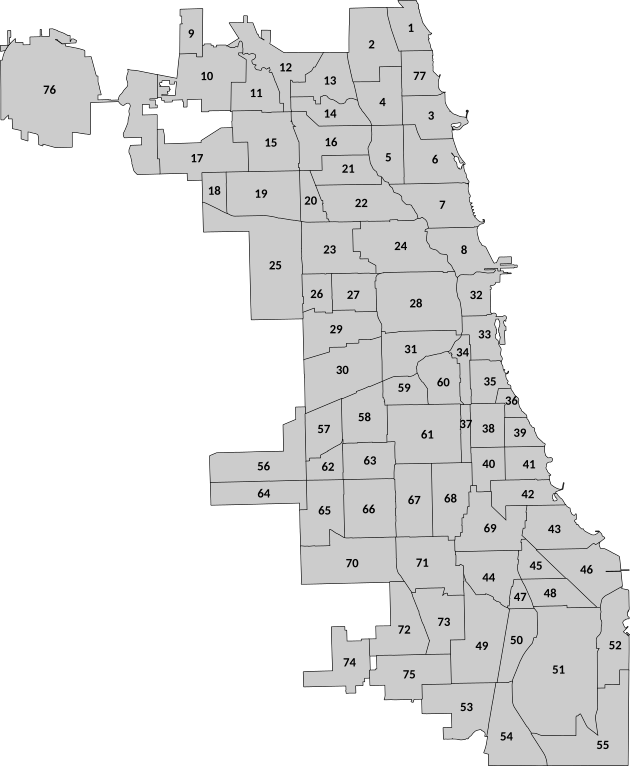
The city of Chicago is split into 77 special areas called community areas. These areas help people study and plan for the city. Information like population numbers and other facts are connected to these areas. This helps with many city planning projects, both big and small. The borders of these areas usually stay the same, which makes it easy to compare information over many years.
Community areas are different from Chicago's many neighborhoods. Sometimes, a community area is the same as a neighborhood, or it might include several neighborhoods. But they don't always match what people commonly think of as neighborhoods. As of 2020, the Near North Side is the busiest area with over 105,000 people. Burnside is the quietest, with just over 2,500 residents. Chicago also has other ways it's divided, like the "sides" created by the Chicago River, the wards for the Chicago City Council, and church parishes.
In the 1920s, a group at the University of Chicago called the Social Science Research Committee created these community areas. They were led by sociologists Robert E. Park and Ernest Burgess. They believed that natural features like rivers or railroads would create areas where people would naturally feel connected. Only two main changes have happened to these areas: O'Hare was added in 1956 when the city grew to include the airport land. Later, in 1980, Edgewater became its own area, separating from Uptown. The fact that these areas don't change much helps Chicago feel like a "city of neighborhoods." It also makes it easier to study and plan for smaller parts of the city.
Contents
How Chicago's Community Areas Started
In the 1800s, the Census Bureau used wards to collect data in cities. But wards were political areas, and their borders changed after every census. This made it hard to compare information over time. By the 1920s, the Social Science Research Committee at the University of Chicago wanted a better way to divide the city. They wanted divisions that felt more natural and were easier to manage than the many small census tracts.
Sociologist Robert E. Park led this idea. He thought that physical things like railroads and the Chicago River created clear, lasting areas in the city. He called these "natural" areas, believing people in them would form a shared identity. Ernest Burgess, another sociologist who agreed with Park, was key in naming and creating the community areas. At first, he found 400 neighborhoods in Chicago! He thought this was too many and cut the number down to 80, then 75, by grouping similar neighborhoods together. The Chicago Department of Public Health also worked with the committee. They wanted to show differences in birth and death rates across the city. Together, they created the list of 75 community areas, which were then divided into 935 smaller census tracts.
After the community areas were set up, the University of Chicago Press published books called the Local Community Fact Book. These books shared data from the 1920 and 1930 Censuses, and even a special 1934 census during the Great Depression. This helped collect important information. The university kept publishing these books for every census until 1990. Today, the Chicago Metropolitan Agency for Planning continues this work. They regularly publish "Community Snapshots" with updated information about the community areas and nearby suburbs.
As mentioned, only two big changes have happened to the community area borders. O'Hare was created when Chicago took over more land in 1956 to control O'Hare International Airport. Edgewater became its own area in 1980. This happened because people living there felt it would help them get support for local improvements if they were separate from Uptown. There have also been small changes due to other land additions and changes along the Lake Michigan shoreline.
List of Chicago's Community Areas
Here is a list of Chicago's 77 community areas, along with their population and size.
| No. | Name | Population | Area | Density | ||
|---|---|---|---|---|---|---|
| (2020)[update] | (sq mi.) | (km2) | (/sq mi.) | (/km2) | ||
| 01 | Rogers Park | 55,628 | 1.84 | 4.77 | 30,232.61 | 11,672.81 |
| 02 | West Ridge | 77,122 | 3.53 | 9.14 | 21,847.59 | 8,435.36 |
| 03 | Uptown | 57,182 | 2.32 | 6.01 | 24,647.41 | 9,516.37 |
| 04 | Lincoln Square | 40,494 | 2.56 | 6.63 | 15,817.97 | 6,107.32 |
| 05 | North Center | 35,114 | 2.05 | 5.31 | 17,128.78 | 6,613.42 |
| 06 | Lake View | 103,050 | 3.12 | 8.08 | 33,028.85 | 12,752.44 |
| 07 | Lincoln Park | 70,492 | 3.16 | 8.18 | 22,307.59 | 8,612.96 |
| 08 | Near North Side | 105,481 | 2.74 | 7.1 | 38,496.72 | 14,863.58 |
| 09 | Edison Park | 11,525 | 1.13 | 2.93 | 10,199.12 | 3,937.88 |
| 10 | Norwood Park | 38,303 | 4.37 | 11.32 | 8,764.99 | 3,384.16 |
| 11 | Jefferson Park | 26,216 | 2.33 | 6.03 | 11,251.5 | 4,344.2 |
| 12 | Forest Glen | 19,596 | 3.2 | 8.29 | 6,123.75 | 2,364.38 |
| 13 | North Park | 17,559 | 2.52 | 6.53 | 6,967.86 | 2,690.29 |
| 14 | Albany Park | 48,396 | 1.92 | 4.97 | 25,206.25 | 9,732.13 |
| 15 | Portage Park | 63,020 | 3.95 | 10.23 | 15,954.43 | 6,160.01 |
| 16 | Irving Park | 51,940 | 3.21 | 8.31 | 16,180.69 | 6,247.36 |
| 17 | Dunning | 43,147 | 3.72 | 9.63 | 11,598.66 | 4,478.24 |
| 18 | Montclare | 14,401 | 0.99 | 2.56 | 14,546.46 | 5,616.39 |
| 19 | Belmont Cragin | 78,116 | 3.91 | 10.13 | 19,978.52 | 7,713.71 |
| 20 | Hermosa | 24,062 | 1.17 | 3.03 | 20,565.81 | 7,940.46 |
| 21 | Avondale | 36,257 | 1.98 | 5.13 | 18,311.62 | 7,070.12 |
| 22 | Logan Square | 71,665 | 3.59 | 9.3 | 19,962.4 | 7,707.48 |
| 23 | Humboldt Park | 54,165 | 3.6 | 9.32 | 15,045.83 | 5,809.2 |
| 24 | West Town | 87,781 | 4.58 | 11.86 | 19,166.16 | 7,400.05 |
| 25 | Austin | 96,557 | 7.15 | 18.52 | 13,504.48 | 5,214.08 |
| 26 | West Garfield Park | 17,433 | 1.28 | 3.32 | 13,619.53 | 5,258.5 |
| 27 | East Garfield Park | 19,992 | 1.93 | 5 | 10,358.55 | 3,999.44 |
| 28 | Near West Side | 67,881 | 5.69 | 14.74 | 11,929.88 | 4,606.13 |
| 29 | North Lawndale | 34,794 | 3.21 | 8.31 | 10,839.25 | 4,185.04 |
| 30 | South Lawndale | 71,399 | 4.59 | 11.89 | 15,555.34 | 6,005.92 |
| 31 | Lower West Side | 33,751 | 2.93 | 7.59 | 11,519.11 | 4,447.53 |
| 32 | (The) Loop | 42,298 | 1.65 | 4.27 | 25,635.15 | 9,897.73 |
| 33 | Near South Side | 28,795 | 1.78 | 4.61 | 16,176.97 | 6,245.93 |
| 34 | Armour Square | 13,890 | 1 | 2.59 | 13,890 | 5,362.93 |
| 35 | Douglas | 20,291 | 1.65 | 4.27 | 12,297.58 | 4,748.09 |
| 36 | Oakland | 6,799 | 0.58 | 1.5 | 11,722.41 | 4,526.02 |
| 37 | Fuller Park | 2,567 | 0.71 | 1.84 | 3,615.49 | 1,395.94 |
| 38 | Grand Boulevard | 24,589 | 1.74 | 4.51 | 14,131.61 | 5,456.21 |
| 39 | Kenwood | 19,116 | 1.04 | 2.69 | 18,380.77 | 7,096.82 |
| 40 | Washington Park | 12,707 | 1.52 | 3.94 | 8,359.87 | 3,227.75 |
| 41 | Hyde Park | 29,456 | 1.61 | 4.17 | 18,295.65 | 7,063.95 |
| 42 | Woodlawn | 24,425 | 2.07 | 5.36 | 11,799.52 | 4,555.79 |
| 43 | South Shore | 53,971 | 2.93 | 7.59 | 18,420.14 | 7,112.01 |
| 44 | Chatham | 31,710 | 2.95 | 7.64 | 10,749.15 | 4,150.25 |
| 45 | Avalon Park | 9,458 | 1.25 | 3.24 | 7,566.4 | 2,921.39 |
| 46 | South Chicago | 27,300 | 3.34 | 8.65 | 8,173.65 | 3,155.85 |
| 47 | Burnside | 2,527 | 0.61 | 1.58 | 4,142.62 | 1,599.47 |
| 48 | Calumet Heights | 13,088 | 1.75 | 4.53 | 7,478.86 | 2,887.59 |
| 49 | Roseland | 38,816 | 4.82 | 12.48 | 8,053.11 | 3,109.31 |
| 50 | Pullman | 6,820 | 2.12 | 5.49 | 3,216.98 | 1,242.08 |
| 51 | South Deering | 14,105 | 10.9 | 28.23 | 1,294.04 | 499.63 |
| 52 | East Side | 21,724 | 2.98 | 7.72 | 7,289.93 | 2,814.64 |
| 53 | West Pullman | 26,104 | 3.56 | 9.22 | 7,332.58 | 2,831.11 |
| 54 | Riverdale | 7,262 | 3.53 | 9.14 | 2,057.22 | 794.29 |
| 55 | Hegewisch | 10,027 | 5.24 | 13.57 | 1,913.55 | 738.82 |
| 56 | Garfield Ridge | 35,439 | 4.23 | 10.96 | 8,378.01 | 3,234.75 |
| 57 | Archer Heights | 14,196 | 2.01 | 5.21 | 7,062.69 | 2,726.9 |
| 58 | Brighton Park | 45,053 | 2.72 | 7.04 | 16,563.6 | 6,395.21 |
| 59 | McKinley Park | 15,923 | 1.41 | 3.65 | 11,292.91 | 4,360.19 |
| 60 | Bridgeport | 33,702 | 2.09 | 5.41 | 16,125.36 | 6,226 |
| 61 | New City | 43,628 | 4.83 | 12.51 | 9,032.71 | 3,487.53 |
| 62 | West Elsdon | 18,394 | 1.17 | 3.03 | 15,721.37 | 6,070.02 |
| 63 | Gage Park | 39,540 | 2.2 | 5.7 | 17,972.73 | 6,939.27 |
| 64 | Clearing | 24,473 | 2.55 | 6.6 | 9,597.25 | 3,705.5 |
| 65 | West Lawn | 33,662 | 2.95 | 7.64 | 11,410.85 | 4,405.73 |
| 66 | Chicago Lawn | 55,931 | 3.53 | 9.14 | 15,844.48 | 6,117.55 |
| 67 | West Englewood | 29,647 | 3.15 | 8.16 | 9,411.75 | 3,633.88 |
| 68 | Englewood | 24,369 | 3.07 | 7.95 | 7,937.79 | 3,064.78 |
| 69 | Greater Grand Crossing | 31,471 | 3.55 | 9.19 | 8,865.07 | 3,422.8 |
| 70 | Ashburn | 41,098 | 4.86 | 12.59 | 8,456.38 | 3,265.01 |
| 71 | Auburn Gresham | 44,878 | 3.77 | 9.76 | 11,903.98 | 4,596.13 |
| 72 | Beverly | 20,027 | 3.18 | 8.24 | 6,297.8 | 2,431.58 |
| 73 | Washington Heights | 25,065 | 2.86 | 7.41 | 8,763.99 | 3,383.78 |
| 74 | Mount Greenwood | 18,628 | 2.71 | 7.02 | 6,873.8 | 2,653.97 |
| 75 | Morgan Park | 21,186 | 3.3 | 8.55 | 6,420 | 2,478.76 |
| 76 | O'Hare | 13,418 | 13.34 | 34.55 | 1,005.85 | 388.36 |
| 77 | Edgewater | 56,296 | 1.74 | 4.51 | 32,354.02 | 12,491.89 |
| Total | Chicago | 2,746,388 | 227.34 | 588.81 | 12,080.53 | 4,664.29 |
Other Ways Chicago is Divided
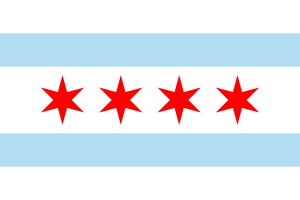
Chicago is also known for its three main "sides": the North Side, West Side, and South Side. The Chicago River helps divide the city into these parts. You can even see these three sides shown as white stripes on the Flag of Chicago.
The city is also split into 50 wards. Each ward elects one person, called an alderman, to the Chicago City Council. These wards sometimes feel like neighborhoods themselves. Unlike community areas, the ward borders are changed every ten years to make sure each ward has about the same number of people.
In areas with many Catholic churches, people might also talk about communities using the name of their church parish. For example, someone might say, "I live in St. Gertrude's, but he is from Saint Ita's."
See also
 In Spanish: Anexo:Áreas comunitarias de Chicago para niños
 | Roy Wilkins |
 | John Lewis |
 | Linda Carol Brown |


