
2017 German federal election facts for kids

The 2017 German federal election was held in Germany on 24 September 2017. The Christian Democratic Union won 33% of the vote, but both them and the Social Democratic Party lost many seats. The Alternative for Germany and Free Democratic Party both entered parliament and made great gains.
Contents
Parties
Major
These parties have received at least 4% of the national vote in the last German federal election, and are predicted to win seats in this next election.
- Christian Democratic Union of Germany (CDU): led by Angela Merkel. The party is liberal conservative and pro-European Union. Together with the Christian Social Union of Bavaria (CSU), a conservative party.
- Social Democratic Party of Germany (SPD): led by Martin Schulz. The party supports social democracy and is pro-European Union.
- The Left: led by Sahra Wagenknecht and Dietmar Bartsch. The Left is a democratic socialist party.
- Alliance '90/The Greens: led by Katrin Göring-Eckardt and Cem Özdemir. The party supports green politics and is pro-European Union.
- Free Democratic Party (FDP): led by Christian Lindner. The party supports classical liberalism and economic liberalism. The FDP is also pro-European Union.
- Alternative for Germany (AfD): led by Alice Weidel and Alexander Gauland. The party is nationalistic and is against the European Union.
Minor
These parties received at least 1% of the national vote in the last German federal election.
- Pirate Party Germany: led by Patrick Schiffer. The party supports Pirate politics and is socially liberal.
- National Democratic Party of Germany (NDP): led by Frank Franz. The NDP is a neo-Nazi party.
- Free Voters: not a registered political party. The association attracts many conservative voters in the south.
Opinion polls
Below is the monthly average of opinion polls towards the election. 
Results
| Parties | Party list | Total seats | |||||
|---|---|---|---|---|---|---|---|
| Votes | % | +/− | Seats | +/− | % | ||
| CDU/CSU | 15,317,344 | 32.93% | 246 | 34.7% | |||
| Social Democratic Party | 9,539,381 | 20.51% | 153 | 21.6% | |||
| Alternative for Germany | 5,878,115 | 12.64% | 94 | 13.3% | |||
| Free Democratic Party | 4,999,449 | 10.75% | 80 | 11.3% | |||
| The Left | 4,297,270 | 9.24% | 69 | 9.7% | |||
| Alliance '90/The Greens | 4,158,400 | 8.94% | 67 | 9.4% | |||
| Free Voters | 463,292 | 1.00% | 0 | 0.0% | |||
| Die PARTEI | 454,349 | 0.98% | 0 | 0.0% | |||
| Human Environment Animal Protection | 374,179 | 0.80% | 0 | 0.0% | |||
| National Democratic Party | 176,020 | 0.38% | 0 | 0.0% | |||
| Pirate Party | 173,476 | 0.37% | 0 | 0.0% | |||
| Others | 684,217 | 1.47% | 0 | 0.0% | |||
| Totals | 46,515,492 | 100.0% | 0 | 709 | 0 | 100.0% | |
Results by state
| State results in % | CDU/CSU | SPD | AfD | FDP | LINKE | GRÜNE | FW | PARTEI | all others |
|---|---|---|---|---|---|---|---|---|---|
| 34.4 | 16.4 | 12.2 | 12.7 | 6.4 | 13.5 | 0.7 | 0.7 | 3.0 | |
| 38.8 | 15.3 | 12.4 | 10.2 | 6.1 | 9.8 | 2.7 | 0.7 | 4.0 | |
| 22.7 | 17.9 | 12.0 | 8.9 | 18.8 | 12.6 | 0.3 | 2.1 | 4.7 | |
| 26.7 | 17.6 | 20.2 | 7.1 | 17.2 | 5.0 | 1.2 | 1.3 | 3.7 | |
| 25.0 | 26.8 | 10.0 | 9.3 | 13.5 | 11.0 | 0.4 | 1.7 | 2.3 | |
| 27.2 | 23.5 | 7.8 | 10.8 | 12.2 | 13.9 | 0.4 | 1.6 | 2.6 | |
| 30.9 | 23.5 | 11.9 | 11.6 | 8.1 | 9.7 | 0.9 | 0.9 | 2.5 | |
| 34.9 | 27.4 | 9.1 | 9.3 | 6.9 | 8.7 | 0.4 | 0.9 | 2.4 | |
| 33.1 | 15.1 | 18.6 | 6.2 | 17.8 | 4.3 | 0.8 | 1.0 | 3.1 | |
| 32.6 | 26.0 | 9.4 | 13.1 | 7.5 | 7.6 | 0.3 | 0.8 | 2.7 | |
| 35.9 | 24.2 | 11.2 | 10.4 | 6.8 | 7.6 | 1.4 | 1.0 | 1.5 | |
| 32.4 | 27.2 | 10.1 | 7.6 | 12.9 | 6.0 | 0.8 | 1.3 | 1.7 | |
| 26.9 | 10.5 | 27.0 | 8.2 | 16.1 | 4.6 | 1.1 | 1.3 | 4.3 | |
| 30.3 | 15.2 | 19.6 | 7.8 | 17.8 | 3.7 | 1.2 | 1.1 | 3.3 | |
| 34.0 | 23.3 | 8.2 | 12.6 | 7.3 | 12.0 | 0.6 | 1.2 | 0.8 | |
| 28.8 | 13.2 | 22.7 | 7.8 | 16.9 | 4.1 | 1.6 | 1.5 | 3.4 |
Voter turnout
| States | Voter turnout |
|---|---|
| 78.3% | |
| 78.2% | |
| 75.6% | |
| 73.7% | |
| 70.7% | |
| 75.9% | |
| 77.0% | |
| 76.4% | |
| 70.9% | |
| 75.4% | |
| 77.6% | |
| 76.6% | |
| 75.4% | |
| 68.1% | |
| 76.5% | |
| 74.3% |
Election leaders
.jpg)


-

Katrin Göring-Eckardt
Greens -

Cem Özdemir
Greens -

Alice Weidel
AfD
.jpg)

.jpg)
.jpg)

Images for kids
-
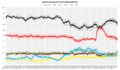
The polls are from September 2013 (the last federal election) up to the current date. Each coloured line specifies a political party.
-
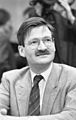
The father of the house of the 19th Bundestag, Hermann Otto Solms

See also
 In Spanish: Elecciones federales de Alemania de 2017 para niños
