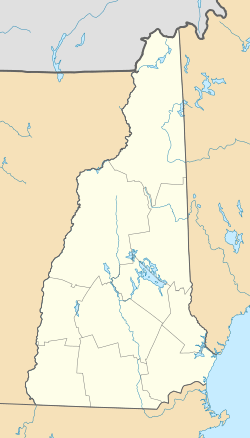
Hanover (CDP), New Hampshire facts for kids
Quick facts for kids
Hanover, New Hampshire
|
|
|---|---|
| Country | United States |
| State | New Hampshire |
| County | Grafton |
| Town | Hanover |
| Area | |
| • Total | 4.91 sq mi (12.71 km2) |
| • Land | 4.52 sq mi (11.71 km2) |
| • Water | 0.38 sq mi (0.99 km2) |
| Elevation | 531 ft (162 m) |
| Population
(2020)
|
|
| • Total | 9,078 |
| • Density | 2,007.52/sq mi (775.11/km2) |
| Time zone | UTC-5 (Eastern (EST)) |
| • Summer (DST) | UTC-4 (EDT) |
| ZIP code |
03755
|
| Area code(s) | 603 |
| FIPS code | 33-33780 |
| GNIS feature ID | 2378069 |
Hanover is a special kind of community called a census-designated place (CDP). It's the main village within the larger town of Hanover in Grafton County, New Hampshire, USA. In 2020, about 9,078 people lived in this CDP. The famous Dartmouth College is also located here.
Contents
Exploring Hanover's Location
This CDP is in the southwestern part of the town of Hanover. To the south, it shares a border with the city of Lebanon. To the west, the Connecticut River flows, marking the border between New Hampshire and Vermont.
Hanover's Borders and Waterways
The northern edge of the CDP reaches the area near Storrs Pond. The eastern border follows a brook from Storrs Pond. It then goes along Camp Brook and Reservoir Road. The border continues south on Grasse Road. It then turns west on Wheelock Street. Finally, it runs over Velvet Rocks and down to Mink Brook. From there, it goes west to New Hampshire Route 120. This route leads south to the Lebanon city line.
Major Roads in Hanover
New Hampshire Route 10 runs right through the center of Hanover. If you go north on Route 10, you'll reach Lyme in about 10 miles. Going south for 4 miles takes you to West Lebanon.
Another important road is Route 10A. It starts from Route 10 in the town center. This road, also known as West Wheelock Street, crosses the Ledyard Bridge. About 1 mile west, it connects to Interstate 91 in Norwich, Vermont.
New Hampshire Route 120 heads southeast from Hanover. It's about 5 miles to Interstate 89. It's also about 6 miles to the center of Lebanon.
Hanover's Size and Area
The Hanover CDP covers a total area of about 12.7 square kilometers (4.9 square miles). Most of this area, about 11.7 square kilometers (4.5 square miles), is land. The remaining 1.0 square kilometer (0.38 square miles) is water. This means about 7.83% of the CDP's area is water.
Hanover's Population and People
| Historical population | |||
|---|---|---|---|
| Census | Pop. | %± | |
| 1950 | 4,999 | — | |
| 1960 | 5,649 | 13.0% | |
| 1970 | 6,147 | 8.8% | |
| 1980 | 6,861 | 11.6% | |
| 1990 | 6,538 | −4.7% | |
| 2000 | 8,162 | 24.8% | |
| 2010 | 8,636 | 5.8% | |
| 2020 | 9,078 | 5.1% | |
| U.S. Decennial Census | |||
The number of people living in the Hanover CDP changes a lot. This is because many Dartmouth College students live here. They live in dorms and other housing.
Population Details from 2010
In 2010, there were 8,636 people living in the CDP. There were 2,095 households and 1,016 families. About 2,276 housing units were counted. Only 181 of these, or 8.0%, were empty.
The people living here came from many backgrounds:
- 77.5% were white.
- 4.3% were African American.
- 1.0% were Native American.
- 12.4% were Asian.
- A very small number (0.02%) were Pacific Islander.
- 0.9% were from other races.
- 3.9% were from two or more races.
- About 4.6% of the people were Hispanic or Latino.
Household and Family Life
Out of all the households, 23.6% had children under 18 living there. About 43.4% were married couples living together. Only 4.0% had a female head of household with no husband. More than half, 51.5%, were not families.
About 36.6% of all households had just one person living there. And 20.6% of these were people aged 65 or older living alone. The average household had 2.28 people. The average family had 2.96 people. Many people (3,861) lived in group places. These included dorms or nursing homes, not private households.
Age Groups in Hanover
The population in the CDP was quite young:
- 10.9% were under 18 years old.
- 49.6% were between 18 and 24 years old.
- 14.2% were between 25 and 44 years old.
- 12.2% were between 45 and 64 years old.
- 13.2% were 65 years or older.
The median age was 22.1 years. This means half the people were younger and half were older than 22.1. For every 100 females, there were about 96.6 males. For every 100 females aged 18 and over, there were about 95.6 males.
Income and Economy
From 2011 to 2015, the average yearly income for a household was about $88,164. For families, the average income was higher, around $156,776. Men working full-time earned about $81,667. Women working full-time earned about $52,111. The per capita income (income per person) for the CDP was $30,497.
About 18.4% of the population and 7.6% of families lived below the poverty line. This included 14.3% of people under 18. It also included 7.4% of people aged 65 or older.
 | Victor J. Glover |
 | Yvonne Cagle |
 | Jeanette Epps |
 | Bernard A. Harris Jr. |


