Income distribution facts for kids
In economics, income distribution is about how all the money earned in a country is shared among its people. Think of it like a big pie: how big are the slices everyone gets? This idea has always been important in economics and how countries make their rules. When income isn't shared fairly, it creates economic inequality, which is a problem in many places around the world.
Contents
What is Income Distribution?
Early economists like Adam Smith and David Ricardo looked at how income was shared between different parts of making things, like land, workers, and money (capital). Today, economists also look at how income is shared among individual people and families. They think about how much income inequality there is and how it affects economic growth. Sometimes, more inequality can slow down growth.
You can see how income is shared using something called the Lorenz curve. This curve helps show how much income inequality there is, often with a number called the Gini coefficient.
How We Measure Income Sharing
Measuring how income is shared is different from just looking at poverty or what seems fair. We use special tools called Income inequality metrics to measure how income is spread out among people in a country or even the whole world. These tools help us see how much difference there is in what people earn.
Challenges in Measuring Income
It can be tricky to measure income sharing perfectly. One challenge is that it's hard to compare big national numbers (like a country's total income) with how income is shared among individuals.
Also, it's not always clear how much government actions, like taxes, change income inequality. We also don't fully understand how more women working has changed income differences over a long time.
Many things can cause income to be shared unequally. These include:
- How the labour market works (how much people get paid for their jobs).
- Rules about taxes.
- Other government rules about money.
- Rules from labor unions.
- How central banks manage money (like interest rates).
- The skills and education of individual workers.
- New technology and automation (machines doing jobs).
- Globalization (countries becoming more connected).
- Unfair treatment based on gender or racism.
- Even a country's culture.
How to Improve Income Sharing
Taxes
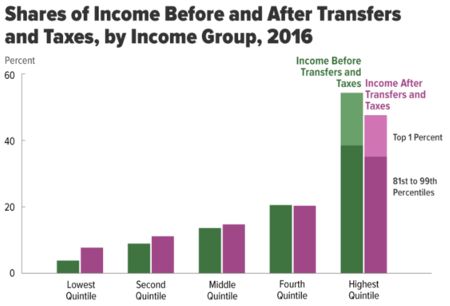
A progressive income tax means that people who earn more money pay a larger percentage of their income in taxes. People who earn less pay a smaller percentage. This helps poorer people keep more of their money. The idea is that a small amount of money means a lot more to someone with low income than to someone who is very rich. The government then uses this tax money for things that help everyone, like schools or roads. This way, everyone gets similar benefits, but richer people pay more for them, which helps reduce inequality.
Help with Food and Essentials
Sometimes, instead of giving money directly, governments give "in-kind transfers." This means giving things like food stamps or actual food to people who need it. This helps make sure people use the help for basic needs.
Housing Help
Rent and housing costs are a big expense for families with lower incomes. Housing subsidies are programs designed to help these families afford good places to live.
Welfare and Unemployment Benefits
These programs give money directly to people who have very little or no income. This allows them to decide how to use the money for their needs. It works best if we assume people will make smart choices for themselves.
Income Mobility
Income mobility looks at how people's financial situation changes over their lives. It's about whether someone moves up or down the ladder of how much they earn. If someone earns more over time, they are "upwardly mobile."
Mobility can be very different:
- If rich people always stay rich and poor people always stay poor, then inequality is a lasting problem.
- If people can easily change their income group (like moving from middle class to upper class), then inequality might be temporary and less of a big problem.
Measuring How People Move Up or Down
We measure income mobility by looking at how similar parents' and their adult children's financial situations are. If they are very similar, it means there's less mobility. We look at different things to measure this:
- Job Status: This looks at the average earnings and education for certain jobs. It's good because it can tell us about parents' jobs even after their children are grown.
- Social Class: This groups people based on their jobs and how that affects their life chances, like income or health.
- Earnings Mobility: This compares the earnings of two generations, like parents and their children, using math to see how they relate.
- Family Income and Women's Mobility: In the past, studies often only looked at fathers and sons. Now, researchers also look at mothers and daughters and total family income to get a fuller picture of how well-being changes across generations.
Income Sharing Around the World
Many groups, like the United Nations and the US Central Intelligence Agency, use the Gini coefficient to measure income inequality in different countries. The Gini index is also used by the World Bank. It's a good way to measure how income is shared in a country. The Gini index goes from 0 to 1. A score of 0 means perfect equality (everyone earns the same), and 1 means perfect inequality (one person earns everything). In 2016, the world's average Gini index was 0.52.
In 2017, the World Inequality Report shared information about how income and wealth are shared globally.
Trends in Income Sharing
Some economic ideas suggest that inequality tends to grow as a country starts to develop, and then it might decrease once the country becomes richer. This idea is called the Kuznets curve. However, many economists don't agree that inequality *has* to increase, and the real information we have about it decreasing later is mixed.
We can look at income inequality in two ways:
- Within a country: This is the inequality among people in the same nation.
- Between countries: This is the inequality between different nations.
A report from 2011 said that the gap between rich and poor in many developed countries was the biggest it had been in over 30 years. This means inequality *within* those countries was growing.
Looking at inequality *between* countries, it has grown a lot over a long time. For example, the Gini coefficient more than doubled between 1820 and the 1980s. However, experts disagree about whether inequality between countries has gone up, stayed the same, or gone down since 1980. This is partly because countries like China and India, with huge populations, have seen their average incomes rise.
Even with these changes, inequality between countries is still very big. For example, the poorest 5% of people in the US earn more than 68% of the world's population. Also, out of the 60 million people who make up the richest 1% globally, 50 million live in Western Europe, North America, or Oceania.
A famous TED Talk by Hans Rosling showed how income distribution has changed in different countries over decades, along with other things like how many children survive and how many children families have.
As of 2018, Albania had the smallest gap in wealth sharing, while Zimbabwe had the largest.
Income Sharing in Different Countries
Thailand
In 2016, Thailand was ranked the third most unequal country in the world, after Russia and India. This means the gap between rich and poor was very wide. A study in 2013 showed that the richest 20% of land owners owned 80% of the country's land. The poorest 20% owned only 0.3%. Also, 0.1% of bank accounts held almost half of all bank deposits. As of As of 2019[update], the average income in Thailand was US$8,000 a year. The government wants to increase this to US$15,000 per year and reduce the income gap.
United States
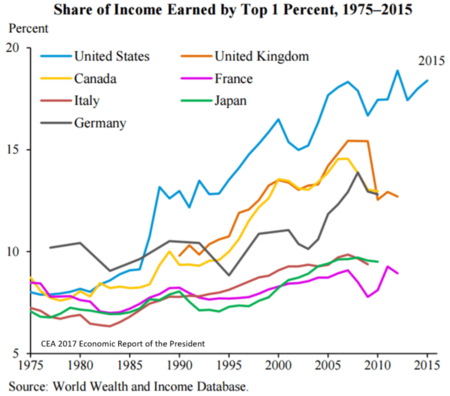
In the United States, income has become more unequally shared over the last 30 years. By 2011, the richest 20% of people earned more than the bottom 80% combined.
By 2019, the wealthiest 10% of American households controlled almost 75% of all household wealth.
- Gini coefficient (after taxes): 0.39.
- Unemployment rate: 4.4%.
- GDP per person: $53,632.
- Poverty rate: 11.1%.
A low unemployment rate and high GDP usually mean a strong economy. However, almost 18% of people live below the poverty line, and the Gini coefficient is quite high. This ranks the United States as the 9th most income-unequal country in the world.
United Kingdom
Inequality in the UK used to be very high, especially before the Industrial Revolution. Back then, the richest 5% earned up to 40% of all income. In recent years, income sharing is still an issue. The UK saw a big increase in inequality in the 1980s, as the richest people's incomes grew while others stayed the same. More recently, incomes have grown for everyone, but the gap remains. With Brexit, there are predictions of even more differences in wages.
In 2019, the United Kingdom was working hard to reduce the gap between rich and poor. It ranked 13th in the world for income inequality.
- Gini coefficient (after taxes): 0.35.
- Unemployment rate: 4.3%.
- GDP per person: $39,425.
- Poverty rate: 11.1%.
Russia
- Gini coefficient (after taxes): 0.38.
- Unemployment rate: 5.2%.
- GDP per person: $24,417.
- Poverty rate: Not available.
Russia ranks 11th in the world for income inequality. Some reports say that corruption is a big problem there. The large income gap is partly due to close ties between very rich business people (oligarchs) and the government. These connections help the oligarchs get profitable business deals, making them even richer.
South Africa
- Gini coefficient (after taxes): 0.62.
- Unemployment rate: 27.3%.
- GDP per person: $12,287.
- Poverty rate: 26.6%.
Based on 2019 data, South Africa has the highest income inequality. This is largely because of its past policy of apartheid, which created huge differences in wages and opportunities between white people and other racial groups.
See also
 In Spanish: Distribución de la renta para niños
- Subsidy
- Poverty
- Gini coefficient
- Redistribution of wealth
- Wealth distribution
 | Jessica Watkins |
 | Robert Henry Lawrence Jr. |
 | Mae Jemison |
 | Sian Proctor |
 | Guion Bluford |


