
Household income in the United States facts for kids
The Household income in the United States is a way to measure how much money people living together in one home earn. This includes all the money received before taxes, like wages from jobs, salaries, and other types of income. Examples of other income are unemployment insurance (money for when you're out of a job) or child support. It doesn't matter if the people in the house are related or not.
In 2005, the average household income in the US was about $46,326. This was similar to Canada's income around that time. There were over 113 million households in the US in 2005. About 17% of these homes earned more than $100,000 a year. On the other hand, about 12.7% of homes earned so little that they were below the federal poverty line.
Since 1990, the average household income has gone up by 44%. However, when you consider inflation (how much prices have gone up), the income has stayed about the same. Household income has risen because more homes now have two or more people earning money.
Contents
Income distribution shows how the total money earned in a country is spread out among different households.
| Income range | Households (thousands) |
Percent |
|---|---|---|
| $0 to $25,000 (28.22%) | ||
| Under $2,500 | 2,566 | 2.26% |
| $2,500 to $4,999 | 1,389 | 1.22% |
| $5,000 to $7,499 | 2,490 | 2.20% |
| $7,500 to $9,999 | 3,360 | 2.96% |
| $10,000 to $12,499 | 4,013 | 3.54% |
| $12,500 to $14,999 | 3,543 | 3.13% |
| $15,000 to $17,499 | 3,760 | 3.32% |
| $17,500 to $19,999 | 3,438 | 3.03% |
| $20,000 to $22,499 | 4,061 | 3.58% |
| $22,500 to $24,999 | 3,375 | 2.98% |
| $25,000 to $50,000 (26.65%) | ||
| $25,000 to $27,499 | 3,938 | 3.48% |
| $27,500 to $29,999 | 2,889 | 2.55% |
| $30,000 to $32,499 | 3,921 | 3.46% |
| $32,500 to $34,999 | 2,727 | 2.41% |
| $35,000 to $37,499 | 3,360 | 2.96% |
| $37,500 to $39,999 | 2,633 | 2.32% |
| $40,000 to $42,499 | 3,378 | 2.98% |
| $42,500 to $44,999 | 2,294 | 2.02% |
| $45,000 to $47,499 | 2,700 | 2.38% |
| $47,500 to $49,999 | 2,371 | 2.09% |
| $50,000 to $75,000 (18.27%) | ||
| $50,000 to $52,499 | 3,071 | 2.71% |
| $52,500 to $54,999 | 2,006 | 1.77% |
| $55,000 to $57,499 | 2,420 | 2.13% |
| $57,500 to $59,999 | 1,786 | 1.57% |
| $60,000 to $62,499 | 2,566 | 2.26% |
| $62,500 to $64,999 | 1,774 | 1.56% |
| $65,000 to $67,499 | 2,101 | 1.85% |
| $67,500 to $69,999 | 1,637 | 1.44% |
| $70,000 to $72,499 | 1,978 | 1.74% |
| $72,500 to $74,999 | 1,413 | 1.24% |
| $75,000 to $100,000 (10.93%) | ||
| $75,000 to $77,499 | 1,802 | 1.59% |
| $77,500 to $79,999 | 1,264 | 1.11% |
| $80,000 to $82,499 | 1,673 | 1.47% |
| $82,500 to $84,999 | 1,219 | 1.07% |
| $85,000 to $87,499 | 1,418 | 1.25% |
| $87,500 to $89,999 | 984 | 0.86% |
| $90,000 to $92,499 | 1,282 | 1.13% |
| $92,500 to $94,999 | 917 | 0.81% |
| $95,000 to $97,499 | 1,023 | 0.90% |
| $97,500 to $99,999 | 846 | 0.74% |
| $100,000 or more (15.73%) | ||
| $100,000 to $149,999 | 11,194 | 9.89% |
| $150,000 to $199,999 | 3,595 | 3.17% |
| $200,000 to $249,999 | 1,325 | 1.17% |
| $250,000 and above | 1,699 | 1.50% |
SOURCE: US Census Bureau, 2005
Income Groups and Household Types
Households are often divided into five equal groups called quintiles based on their income. Each quintile represents 20% of all households.
The type of household often relates to its income. For example, married couples are more likely to be in the higher income groups. This is often because they have two people earning money. Households with single people are more often in the lower income groups. Homes led by single women are especially common in the lowest income groups.
Homes with higher incomes are much more likely to be owned by the people living in them, rather than rented.
| Data | All households | Lowest fifth | Second fifth | Middle fifth | Fourth fifth | Highest fifth | Top 5% |
|---|---|---|---|---|---|---|---|
| Households (in 1000s) | 113,146 | 22,629 | 22,629 | 22,629 | 22,629 | 22,629 | 5,695 |
| Lower limit | $0 | $0 | $18,500 | $34,738 | $55,331 | $88,030 | $157,176 |
| Median number of income earners | 1 | 0 | 1 | 1 | 2 | 2 | 2 |
| Tenure | |||||||
| Owner occupied | 62.4% | 49.0% | 58.8% | 68.9% | 80.5% | 90.0% | 92.8% |
| Renter occupied | 29.2% | 48.3% | 39.7% | 29.9% | 18.7% | 9.6% | 6.9% |
| Type of household | |||||||
| Family households | 68.06% | 41.06% | 59.97% | 70.04% | 80.87% | 88.35% | 90.61% |
| Married couple families | 51.35% | 19.03% | 38.89% | 51.00% | 67.05% | 80.08% | 85.59% |
| Single-male family | 4.32% | 3.08% | 4.64% | 5.69% | 4.89% | 3.30% | 2.47% |
| Single-female family | 12.38% | 18.94% | 16.43% | 13.35% | 8.93% | 4.24% | 2.54% |
| Non-family households | 31.93% | 58.92% | 40.02% | 29.96% | 19.12% | 11.64% | 9.36% |
SOURCE: US Census Bureau, 2004
Income and Race
Even though many African Americans and Latino Americans have joined the middle class, there are still differences in income among different racial groups.
In 2000, about 75% of people in the US were Caucasian (White, not Hispanic). However, almost 88% of the households in the top 5% income group were led by someone who identified as White.
Households led by Asian Americans were more likely to be in the top income groups. For example, in the top 5% income group, the percentage of Asian households was almost double their percentage in the general population.
Households led by Hispanic and African American people were less common in the top income groups and more common in the bottom income groups.
| Race | All households | Lowest fifth | Second fifth | Middle fifth | Fourth fifth | Highest fifth | Top 5% | |
|---|---|---|---|---|---|---|---|---|
| White alone | Number in 1000s | 92,702 | 16,940 | 18,424 | 18,978 | 19,215 | 19,721 | 5,695 |
| Percentage | 81.93% | 74.87% | 81.42% | 83.87% | 84.92% | 87.16% | 87.93% | |
| Asian alone | Number in 1000s | 4,140 | 624 | 593 | 786 | 871 | 1,265 | 366 |
| Percentage | 3.65% | 2.76% | 2.26% | 3.47% | 3.84% | 5.59% | 6.46% | |
| African American or Black | Number in 1000s | 13,792 | 4,474 | 3,339 | 2,637 | 2,053 | 1,287 | 236 |
| Percentage | 12.19% | 19.77% | 14.75% | 11.65% | 9.07% | 5.69% | 1.04% | |
| Hispanic or Latino (of any race) |
Number in 1000s | 12,838 | 3,023 | 3,130 | 2,863 | 1,931 | 1,204 | 269 |
| Percentage | 11.33% | 13.56% | 13.83% | 12.20% | 8.53% | 5.89% | 1.19% | |
SOURCE: US Census Bureau, 2004
Education and Gender's Impact on Income
The more education a person has, the more money they tend to earn. For example, in 2005, people with a Master's in Business Administration (MBA) degree were expected to earn a base salary of $88,626. People with doctorates (the highest degree) earned about $81,400.
Even though education helps everyone earn more, there is still an income gap between men and women. For example, a man with a professional degree might earn about 40% more over his lifetime than a woman with the same degree.
Higher education helps households earn more money. Households where the main earner has a bachelor's degree or higher tend to have much higher incomes.
| Criteria | Overall | Less than 9th grade | Some high school | High school graduate | Some college | Associates degree | Bachelor's degree | Bachelor's degree or more | Master's degree | Professional degree | Doctorate degree | |
|---|---|---|---|---|---|---|---|---|---|---|---|---|
| Median individual income | Male, age 25+ | $33,517 | $15,461 | $18,990 | $28,763 | $35,073 | $39,015 | $50,916 | $55,751 | $61,698 | $88,530 | $73,853 |
| Female, age 25+ | $19,679 | $9,296 | $10,786 | $15,962 | $21,007 | $24,808 | $31,309 | $35,125 | $41,334 | $48,536 | $53,003 | |
| Both sexes, age 25+ | $32,140 | $17,422 | $20,321 | $26,505 | $31,054 | $35,009 | $43,143 | $49,303 | $52,390 | 82,473 | $70,853 | |
| Median household income | $45,016 | $18,787 | $22,718 | $36,835 | $45,854 | $51,970 | $68,728 | $73,446 | $78,541 | $100,000 | $96,830 | |
SOURCE: US Census Bureau, 2003
Since 1991, the median income for households and individuals has changed. It increased during the 1990s, reaching a high point in 1999, but has decreased slightly since then.
For people with less than a four-year college degree, the median household income has generally gone down since 1991. However, for those with a bachelor's degree or more, income has increased.
| Year | Overall Median | Less than 9th grade | High school drop-out | High school graduate | Some college | Associates degree | Bachelor's degree | Bachelor's degree or more | Master's degree | Professional degree | Doctorate degree |
|---|---|---|---|---|---|---|---|---|---|---|---|
| 1991 | $40,873 | $17,414 | $23,096 | $37,520 | $46,296 | $52,289 | $64,150 | $68,845 | $72,669 | $102,667 | $92,614 |
| 1993 | $40,324 | $17,450 | $22,523 | $35,979 | $44,153 | $49,622 | $64,537 | $70,349 | $75,645 | $109,900 | $93,712 |
| 1995 | $42,235 | $18,031 | $21,933 | $37,609 | $44,537 | $50,485 | $63,357 | $69,584 | $77,865 | $98,302 | $95,899 |
| 1997 | $43,648 | $17,762 | $22,688 | $38,607 | $45,734 | $51,726 | $67,487 | $72,338 | $77,850 | $105,409 | $99,699 |
| 1999 | $46,236 | $19,008 | $23,977 | $39,322 | $48,588 | $54,282 | $70,925 | $76,958 | $82,097 | $110,383 | $107,217 |
| 2001 | $45,300 | $18,830 | $24,162 | $37,468 | $47,605 | $53,166 | $69,796 | $75,116 | $81,993 | $103,918 | $96,442 |
| 2003 | $45,016 | $18,787 | $22,718 | $36,835 | $45,854 | $51,970 | $68,728 | $73,446 | $78,541 | $100,000 | $96,830 |
| Average | $43,376 | $18,183 | $23,013 | $37,620 | $46,109 | $51,934 | $66,997 | $72,376 | $78,094 | $104,368 | $94,487 |
SOURCE: US Census Bureau, 2003
Income and Age of Householder
Household income changes a lot depending on the age of the person who is considered the head of the household. Generally, income goes up as the householder gets older, reaching its peak around middle age (45-54 years old). After retirement age, household income tends to go down.
The highest median household income was found in homes led by people between 45 and 54 years old, with an average of $61,111. The lowest incomes were in homes led by people younger than 24 or older than 75. This shows that income usually increases as people gain experience and then decreases as they retire.
Household Income Over Time
Please note that all figures are presented in 2003 dollars, meaning they are adjusted for inflation.
Since 1967, the average household income in the US has gone up a little, but it has also gone up and down many times. Even though people are earning more individually and many homes now have two people working, the overall household income hasn't increased a lot.
This is partly because the types of households in America have changed. For example, in 1969, over 40% of homes were married couples with children. By 1996, this was only about a quarter of US households. Even though married couples with children often earn the most, their smaller number means the overall average household income doesn't rise as much.
"From 1969 to 1996, median household income rose a very modest 6.3 percent... The stagnation in median household income may, in fact, be largely a reflection of changes in the size and composition of households rather than a reflection of a stagnating economy."- John McNeil, US Census Bureau
The average household income went from $33,338 in 1967 to its highest point of $44,922 in 1999. Since then, it has gone down slightly to $43,318. Income usually drops during recessions (when the economy slows down) and goes up when the economy is doing well.
Over time, wealthier households have seen their incomes grow faster than poorer households. For example, the income for the top 20% of households increased by 57.2% from 1967 to 2003. During the same time, the income for the bottom 20% of households only increased by 28%. This growing gap might be due to more women joining the workforce, leading to more two-income households in the higher income groups.
| Data | 2003 | 2000 | 1997 | 1994 | 1991 | 1988 | 1985 | 1982 | 1979 | 1976 | 1973 | 1970 | 1967 |
|---|---|---|---|---|---|---|---|---|---|---|---|---|---|
| 20th percentile | $17,984 | $19,142 | $17,601 | $16,484 | $16,580 | $17,006 | $16,306 | $15,548 | $16,457 | $15,615 | $15,844 | $15,126 | $14,002 |
| Median (50th) | $43,318 | $44,853 | $42,294 | $39,613 | $39,679 | $40,678 | $38,510 | $36,811 | $38,649 | $36,155 | $37,700 | $35,832 | $33,338 |
| 80th percentile | $86,867 | $87,341 | $81,719 | $77,154 | $74,759 | $75,593 | $71,433 | $66,920 | $68,318 | $63,247 | $64,500 | $60,148 | $55,265 |
| 95th percentile | $154,120 | $155,121 | $144,636 | $134,835 | $126,969 | $127,958 | $119,459 | $111,516 | $111,445 | $100,839 | $102,243 | $95,090 | $88,678 |
SOURCE: US Census Bureau, 2004 (Page 44/45)
Income by State
The average household income varies a lot from state to state. In 2005, New Hampshire had the highest median household income at $57,352. West Virginia had the lowest at $32,589.
The states in the Northeast (like New Hampshire and Connecticut) and the West (like California and Washington) generally had the highest incomes. The Southern states generally had the lowest incomes.
| State | Rank | Median household income | +/- national average | Change 1999-2005 (inflation adjusted) |
|---|---|---|---|---|
| New Hampshire | 1 | 57,352 | +12,879 | -2% |
| New Jersey | 2 | 56,772 | +12,299 | -4.5% |
| Maryland | 3 | 56,763 | +12,290 | -0.5% |
| Connecticut | 4 | 55,970 | +11,497 | -3.5% |
| Minnesota | 5 | 55,914 | +11,441 | -5.7% |
| Alaska | 6 | 54,627 | +10,154 | -6.9% |
| Virginia | 7 | 53,275 | +8,802 | -0.8% |
| Hawaii | 8 | 53,123 | +8,650 | -0.4% |
| Massachusetts | 9 | 52,354 | +7,881 | -3.3% |
| Colorado | 10 | 51,022 | +6,549 | -8.4% |
| Utah | 11 | 50,614 | +5,691 | -10.5% |
| Delaware | 12 | 50,152 | +5,679 | -5.4% |
| California | 13 | 49,894 | +5,421 | -3.6% |
| Washington | 14 | 48,688 | +4,215 | -8.1% |
| Wisconsin | 15 | 47,220 | +2,747 | -8.2% |
| Nevada | 16 | 46,984 | +2,511 | -5.8% |
| Rhode Island | 17 | 46,199 | +1,726 | +4.4% |
| Illinois | 18 | 45,787 | +1,314 | -7.9% |
| Vermont | 19 | 45,692 | +1,219 | -4.5% |
| Nebraska | 20 | 44,623 | +150 | -4.6% |
| Michigan | 21 | 44,476 | +3 | -12% |
| United States national average ($44,473) -6% | ||||
| Pennsylvania | 22 | 44,286 | -187 | -5.2% |
| New York | 23 | 44,228 | -245 | -2.7% |
| Ohio | 24 | 44,160 | -313 | -9.3% |
| Missouri | 25 | 43,988 | -485 | -5.5% |
| Kansas | 26 | 43,725 | -748 | -9.8% |
| Wyoming | 27 | 43,641 | -832 | +4.1% |
| Georgia | 28 | 43,217 | -1,256 | -8.3% |
| Iowa | 29 | 43,042 | -1,431 | -5.7% |
| District of Columbia | 30 | 43,003 | -1,470 | +0.5% |
| Indiana | 30 | 43,003 | -1,470 | -9.7% |
| Oregon | 31 | 42,617 | -1,856 | -10.4% |
| Arizona | 32 | 42,590 | -1,883 | -6.8% |
| Idaho | 33 | 42,519 | -1,954 | -5.8% |
| Texas | 34 | 41,275 | -3,198 | -9.9% |
| South Dakota | 35 | 40,518 | -3,955 | -2.5% |
| Florida | 36 | 40,171 | -4,302 | -6.7% |
| North Dakota | 37 | 39,594 | -4,879 | +1.2% |
| Maine | 38 | 39,395 | -5,078 | -1.9% |
| South Carolina | 39 | 39,326 | -5,147 | -9.5% |
| North Carolina | 40 | 39,000 | -5,473 | -11.3% |
| Tennessee | 41 | 38,550 | -5,923 | -8.7% |
| Oklahoma | 42 | 38,281 | -6,192 | -5.3% |
| Alabama | 43 | 38,111 | -6,362 | -7.8% |
| New Mexico | 44 | 37,587 | -6,886 | -6.2% |
| Kentucky | 45 | 37,396 | -7,077 | -5.3% |
| Louisiana | 46 | 35,523 | -8,950 | -3.7% |
| Montana | 47 | 35,201 | -9,272 | +1.6% |
| Arkansas | 48 | 33,948 | -10,525 | -7.2% |
| Mississippi | 49 | 33,659 | -10,814 | -10.3% |
| West Virginia | 50 | 32,589 | -11,884 | -3.8% |
SOURCE: US Census Bureau, 2004/05
Understanding Median Income
The median income is the middle point of all household incomes. This means half of all households earn more than the median income, and half earn less. In 2004, the median household income in the US was $43,389. The Census Bureau says the median is a better way to understand typical income than the average, because it's not as affected by a few very rich households.
Median household income changes based on race, the size of the household, and where the household is located.
- The Northeast had the highest median income ($47,994).
- The West was second ($47,680).
- The Mid-West was third ($44,657).
- The South had the lowest ($40,773).
Household income tends to increase as the number of people in a household grows, up to four people. After four people, the income starts to go down. For example, a four-person household had a median income of $54,338, but a seven-or-more-person household had a median income of $42,471.
When looking at race, Asian Americans had the highest median household income ($57,518). European Americans were second ($48,977). Hispanic or Latino households were third ($34,241). African American or Black households had the lowest median income ($30,134).
Understanding Mean Income
The mean income is the average income of all households. You get it by adding up all the incomes and dividing by the number of households. The mean income is usually higher than the median income because a few very high incomes can pull the average up.
In 2004, the mean household income in the US was $60,528. This was about $17,210 higher than the median income.
"Median income is the amount which divides the the income distribution into two equal groups, half having income above that amount, and half having income below that amount. Mean income (average) is the amount obtained by dividing the total aggregate income of a group by the number of units in that group."
-US Census Bureau, Frequently Asked Question, published by First Gov.
The mean household income for households led by White people was $65,317. For African American or Black households, it was $40,685. For Hispanic or Latino households, it was $45,871. For Asian households, it was $76,747.
About 36.5% of all households earned more than the mean income, while 63.5% earned less.
Images for kids
-
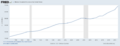
Median US household income through 2019
-

U.S. real median household income reached $63,688 in January 2019, an increase of $171 or 0.3% over one month (December 2018) .
-
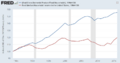
U.S. economic growth is not translating into higher median family incomes. Real GDP per household has typically increased since the year 2000, while real median income per household was below 1999 levels until 2016, indicating a trend of greater income inequality.
-
Total compensation's share of GDP has declined by 4.5 percentage points from 1970 to 2016. This implies that the share attributed to capital increased in that period.
-
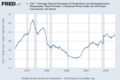
U.S. real wages (i.e. production) for ordinary (i.e. non-supervisory) workers remain slightly below their 1970s peak.
-
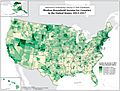
Median household income, by county, as of 2017.
-
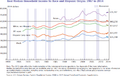
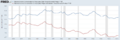
This graph shows the income since 1970 of different racial and ethnic groups in the United States (in 2014 dollars).
-
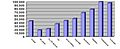
Median annual household income in accordance with the householder's educational attainment. The data only includes households with a householder over the age of twenty-five.
-
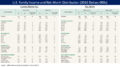
U.S. family pre-tax income and net worth distribution for 2013 and 2016, from the Federal Reserve Survey of Consumer Finances.
-
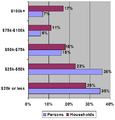
Percentage of persons and households in each of the income groups shown.
-
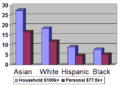
The percent of households with six figure incomes and individuals with incomes in the top 10%, exceeding $77,500.


.jpg)


