Distribution of wealth facts for kids
The distribution of wealth looks at how wealth is shared among different people or groups in a society. It helps us understand how much economic inequality there is.
Wealth distribution is different from income distribution. Income is about the money people earn regularly, like from a job. Wealth is about what people own, like houses, savings, or investments, minus any debts they have. Experts say that wealth is usually much more unevenly shared than income.
You can find rankings of wealth distribution for different countries by looking at lists like list of countries by wealth equality.
What is Wealth?
For a person, wealth is their net worth. This means: Wealth = What you own (like money, property) − What you owe (like loans or mortgages).
Sometimes, a broader idea of wealth is used. For example, the United Nations talks about inclusive wealth. This includes natural resources, people's skills (human capital), and physical things like buildings.
Your wealth changes based on how much you save. Saving is your income minus your expenses. If someone earns a lot but also spends a lot, their wealth might not grow much.
How We Measure Wealth Distribution
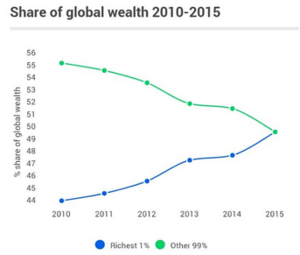
There are different ways to look at how wealth is shared. One way is to compare the wealth of the richest people to the wealth of average people. For example, we might look at how much wealth the top 1% of people have compared to everyone else.
In many societies, the richest 10% of people own more than half of all the wealth. The Pareto distribution is a math idea often used to describe this. It suggests that a small percentage of people hold a large percentage of the wealth. For instance, the top 20% might own 80% of the wealth.
Wealth over people (WOP) curves are a visual way to show wealth distribution. Imagine lining up everyone in a country from richest to poorest. The curve shows how their wealth compares to the average wealth of the richest people.
In a perfectly equal society, everyone would have the same wealth. In a very unequal society, a few people would have almost all the wealth, and most people would have very little. The Gini coefficient is a number that helps us measure this inequality.
Why Wealth Distribution Matters
Understanding wealth distribution helps us see how money and resources are spread out. Early studies often used tax records to see how unequal wealth was. They found that inheriting money played a big part in how wealth was passed down through families.
More recently, studies look at why individuals have different amounts of wealth. This includes how much people save for retirement. New data also helps researchers understand how personal and household details affect wealth differences.
Wealth Inequality Around the World
Wealth inequality means that wealth is not shared evenly among people. Even in ancient times, archaeologists can see wealth differences by looking at house sizes. Larger houses often belonged to wealthier families. Studies show that ancient wealth differences were greater in places like Eurasia than in North America.
Global Wealth Statistics
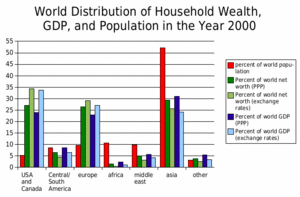
A study by the United Nations University found that in 2000, the richest 1% of adults owned 40% of all global assets. The richest 10% owned 85% of the world's total wealth. The poorest half of the world's adults owned only 1% of global wealth.
In 2012, the top 0.6% of the world's population (people with over US$1 million in assets) held 39.3% of global wealth. The next 4.4% held 32.3%. This means the richest 5% of people owned over 70% of the world's wealth. The remaining 95% of people shared less than 30%.
A 2021 Oxfam report showed that the 10 richest men in the world owned more wealth than the poorest 3.1 billion people combined. Their wealth even doubled during the COVID-19 pandemic.
The 'Global Wealth Report 2021' by Credit Suisse showed that wealth inequality increased a lot in 2020. The richest 1.1% of adults owned 45.8% of all wealth. This was an increase of 4.8% since 2013. The poorest half of the world's adults owned only 1.3% of the total wealth, a decrease from 2013.
One reason for this increase in inequality is the COVID-19 pandemic. Credit Suisse believes the pandemic hurt the lowest wealth groups, making them spend savings or go into debt. Richer groups were less affected and even benefited from lower interest rates, which increased the value of their stocks and houses.
In 2020, there were 56 million millionaires worldwide. The United States had the most, with 22 million millionaires (about 39% of the world's total). China was second with 9.4%, and Japan was third with 6.6%.
Real Estate and Wealth
Owning land is a big part of wealth. For example, in Baltimore, Maryland, the top 10% of land owners (mostly companies) own 58% of the land's value. The bottom 10% of land owners own less than 1%. This shows how land ownership can also be very unequal.
The Wealth Pyramid
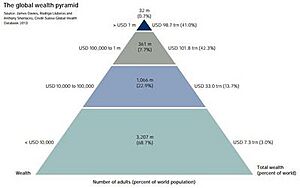
In 2013, Credit Suisse created a wealth pyramid to show global wealth distribution. It showed that:
- Half of the world's total wealth belonged to the top 1% of adults.
- The top 10% of adults held 85% of the world's total wealth.
- The bottom 90% held only 15%.
- About 3.2 billion people (more than two-thirds of adults) had wealth below US$10,000.
Wealth Pyramid in 2020
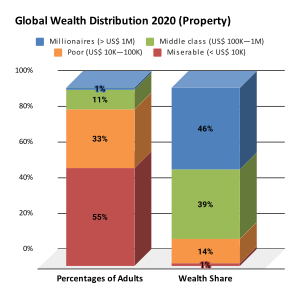
In 2020, Credit Suisse updated its wealth pyramid.
- About 2.88 billion people (55% of adults) had wealth below US$10,000.
- 1.7 billion people (38.2% of adults) had wealth between US$10,000 and US$100,000.
- 583 million people had wealth between US$100,000 and US$1,000,000.
- About 56 million people (1.1% of adults) had wealth over US$1,000,000.
Comparing 2013 and 2020
The 2020 pyramid showed some big changes. For the first time, more than 1% of adults were millionaires. Credit Suisse explained that the pandemic caused economic changes that benefited those with financial assets. The number of people in the US$10,000 to US$100,000 group grew a lot, especially due to growing economies like China.
Future Wealth Trends (2020-2025)
The 'Global Wealth Report 2021' predicted that global wealth would increase by 39% by 2025. The number of millionaires was also expected to grow significantly, possibly exceeding 84 million by 2025. This growth is expected in both developed and developing countries, with China seeing a very large increase in millionaires.
Gini Coefficient Explained
The Gini coefficient is a number from 0 to 1 (or 0% to 100%) that measures inequality.
- A Gini coefficient of 0 means perfect equality: everyone has the same wealth.
- A Gini coefficient of 1 (or 100%) means extreme inequality: one person has all the wealth, and everyone else has none.
According to the Credit Suisse 'Global Wealth Report 2021', Brunei had the highest Gini coefficient in 2021 (91.6%), meaning its wealth distribution was very unequal. Slovakia had the lowest (50.3%), making it the most equal country in terms of wealth distribution. The report noted an increasing trend of wealth inequality since 2019, possibly due to the COVID-19 pandemic.
| Click at right to show/hide table with detailed statistics | |||||||||||||||||||||||||||||||||||||||||||||||||||||||||||||||||||||||||||||||||||||||||||||||||||||||||||||||||||||||||||||||||||||||||||||||||||||||||||||||||||||||||||||||||||||||||||||||||||||||||||||||||||||||||||||||||||||||||||||||||||||||||||||||||||||||||||||||||||||||||||||||||||||||||||||||||||||||||||||||||||||||||||||||||||||||||||||||||||||||||||||||||||||||||||||||||||||||||||||||||||||||||||||||||||||||||||||||||||||||||||||||||||||||||||||||||||||||||||||||||||||||||||||||||||||||||||||||||||||||||||||||||||||||||||||||||||||||||||||||||||||||||||||||||||||||||||||||||||||||||||||||||||||||||||||||||||||||||||||||||||||||||||||||||||||||||||||||||||||||||||||||||||||||||||||||||||||||||||||||||||||||||||||||||||||||||||||||||||||||||||||||||||||||||||||||||||||||||||||||||||||||||||||||||||||||||||||||||||||||||||||||||||||||||||||||||||||||||||||||||||||||||||||||||||||||||||||||||||||||||||||||||||||||||||||||||||||||||||||||||||||||||||||||||||||||||||||||||||||||
|---|---|---|---|---|---|---|---|---|---|---|---|---|---|---|---|---|---|---|---|---|---|---|---|---|---|---|---|---|---|---|---|---|---|---|---|---|---|---|---|---|---|---|---|---|---|---|---|---|---|---|---|---|---|---|---|---|---|---|---|---|---|---|---|---|---|---|---|---|---|---|---|---|---|---|---|---|---|---|---|---|---|---|---|---|---|---|---|---|---|---|---|---|---|---|---|---|---|---|---|---|---|---|---|---|---|---|---|---|---|---|---|---|---|---|---|---|---|---|---|---|---|---|---|---|---|---|---|---|---|---|---|---|---|---|---|---|---|---|---|---|---|---|---|---|---|---|---|---|---|---|---|---|---|---|---|---|---|---|---|---|---|---|---|---|---|---|---|---|---|---|---|---|---|---|---|---|---|---|---|---|---|---|---|---|---|---|---|---|---|---|---|---|---|---|---|---|---|---|---|---|---|---|---|---|---|---|---|---|---|---|---|---|---|---|---|---|---|---|---|---|---|---|---|---|---|---|---|---|---|---|---|---|---|---|---|---|---|---|---|---|---|---|---|---|---|---|---|---|---|---|---|---|---|---|---|---|---|---|---|---|---|---|---|---|---|---|---|---|---|---|---|---|---|---|---|---|---|---|---|---|---|---|---|---|---|---|---|---|---|---|---|---|---|---|---|---|---|---|---|---|---|---|---|---|---|---|---|---|---|---|---|---|---|---|---|---|---|---|---|---|---|---|---|---|---|---|---|---|---|---|---|---|---|---|---|---|---|---|---|---|---|---|---|---|---|---|---|---|---|---|---|---|---|---|---|---|---|---|---|---|---|---|---|---|---|---|---|---|---|---|---|---|---|---|---|---|---|---|---|---|---|---|---|---|---|---|---|---|---|---|---|---|---|---|---|---|---|---|---|---|---|---|---|---|---|---|---|---|---|---|---|---|---|---|---|---|---|---|---|---|---|---|---|---|---|---|---|---|---|---|---|---|---|---|---|---|---|---|---|---|---|---|---|---|---|---|---|---|---|---|---|---|---|---|---|---|---|---|---|---|---|---|---|---|---|---|---|---|---|---|---|---|---|---|---|---|---|---|---|---|---|---|---|---|---|---|---|---|---|---|---|---|---|---|---|---|---|---|---|---|---|---|---|---|---|---|---|---|---|---|---|---|---|---|---|---|---|---|---|---|---|---|---|---|---|---|---|---|---|---|---|---|---|---|---|---|---|---|---|---|---|---|---|---|---|---|---|---|---|---|---|---|---|---|---|---|---|---|---|---|---|---|---|---|---|---|---|---|---|---|---|---|---|---|---|---|---|---|---|---|---|---|---|---|---|---|---|---|---|---|---|---|---|---|---|---|---|---|---|---|---|---|---|---|---|---|---|---|---|---|---|---|---|---|---|---|---|---|---|---|---|---|---|---|---|---|---|---|---|---|---|---|---|---|---|---|---|---|---|---|---|---|---|---|---|---|---|---|---|---|---|---|---|---|---|---|---|---|---|---|---|---|---|---|---|---|---|---|---|---|---|---|---|---|---|---|---|---|---|---|---|---|---|---|---|---|---|---|---|---|---|---|---|---|---|---|---|---|---|---|---|---|---|---|---|---|---|---|---|---|---|---|---|---|---|---|---|---|---|---|---|---|---|---|---|---|---|---|---|---|---|---|---|---|---|---|---|---|---|---|---|---|---|---|---|---|---|---|---|---|---|---|---|---|---|---|---|---|---|---|---|---|---|---|---|---|---|---|---|---|---|---|---|---|---|---|---|---|---|---|---|---|---|---|---|---|---|---|---|---|---|---|---|---|---|---|---|---|---|---|---|---|---|---|---|---|---|---|---|---|---|---|---|---|---|---|---|---|---|---|---|---|---|---|---|---|---|---|---|---|---|---|---|---|---|---|---|---|---|---|---|---|---|---|---|---|---|---|---|---|---|---|---|---|---|---|---|---|---|---|---|---|---|---|---|---|---|---|---|---|---|---|---|---|---|---|---|---|---|---|---|---|---|---|---|---|---|---|---|---|---|---|---|---|---|---|---|---|---|---|---|---|---|---|---|---|---|---|---|---|---|---|---|---|---|---|---|---|---|---|---|---|---|---|---|---|---|---|---|---|---|---|---|---|---|---|---|---|---|---|---|---|---|---|---|---|---|---|---|---|---|---|---|---|---|---|---|---|---|---|---|---|---|---|---|---|---|---|---|---|---|---|---|---|---|---|---|---|---|---|---|---|---|---|---|---|---|---|---|---|---|---|---|---|---|---|---|---|---|
|
|||||||||||||||||||||||||||||||||||||||||||||||||||||||||||||||||||||||||||||||||||||||||||||||||||||||||||||||||||||||||||||||||||||||||||||||||||||||||||||||||||||||||||||||||||||||||||||||||||||||||||||||||||||||||||||||||||||||||||||||||||||||||||||||||||||||||||||||||||||||||||||||||||||||||||||||||||||||||||||||||||||||||||||||||||||||||||||||||||||||||||||||||||||||||||||||||||||||||||||||||||||||||||||||||||||||||||||||||||||||||||||||||||||||||||||||||||||||||||||||||||||||||||||||||||||||||||||||||||||||||||||||||||||||||||||||||||||||||||||||||||||||||||||||||||||||||||||||||||||||||||||||||||||||||||||||||||||||||||||||||||||||||||||||||||||||||||||||||||||||||||||||||||||||||||||||||||||||||||||||||||||||||||||||||||||||||||||||||||||||||||||||||||||||||||||||||||||||||||||||||||||||||||||||||||||||||||||||||||||||||||||||||||||||||||||||||||||||||||||||||||||||||||||||||||||||||||||||||||||||||||||||||||||||||||||||||||||||||||||||||||||||||||||||||||||||||||||||||||||||
Wealth Across Different Regions
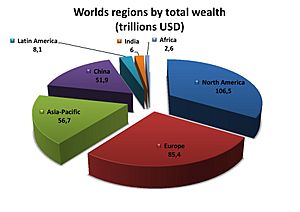
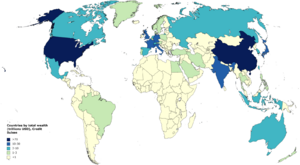
Wealth is not spread evenly across the world. In the past, it was mostly found in rich countries like the G8 nations and some Asian and OPEC countries. Today, the United States leads with 30.2% of global wealth, and wealth is still concentrated in developed countries and some Asia-Pacific and OPEC nations.
-
World distribution of wealth by country (PPP)
Wealth by World Region
| Region | Proportion of world (%) | ||||
|---|---|---|---|---|---|
| Population | Net worth | GDP | |||
| PPP | Exchange rates | PPP | Exchange rates | ||
| North America | 5.2 | 27.1 | 34.4 | 23.9 | 33.7 |
| Central/South America | 8.5 | 6.5 | 4.3 | 8.5 | 6.4 |
| Europe | 9.6 | 26.4 | 29.2 | 22.8 | 32.4 |
| Africa | 10.7 | 1.5 | 0.5 | 2.4 | 1.0 |
| Middle East | 9.9 | 5.1 | 3.1 | 5.7 | 4.1 |
| Asia | 52.2 | 29.4 | 25.6 | 31.1 | 24.1 |
| Other | 3.2 | 3.7 | 2.6 | 5.4 | 3.4 |
| Totals (rounded) | 100% | 100% | 100% | 100% | 100% |
Wealth in the United States
In 2011, the 400 richest Americans had more wealth than half of all Americans combined. Many rich Americans got a "substantial head start" from inherited wealth. In 2012, over 60% of the Forbes 400 Richest Americans grew up with significant advantages.
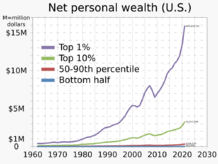
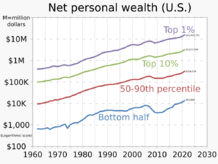
In 2007, the richest 1% of Americans owned 34.6% of the country's total wealth. The next 19% owned 50.5%. This meant the top 20% of Americans owned 85% of the country's wealth, while the bottom 80% owned only 15%.
After the Great Recession that started in 2007, the share of wealth owned by the top 1% grew to 37.1%. The wealth of the top 20% grew to 87.7%. The recession caused a big drop in wealth for average households, but a much smaller drop for the richest 1%. This made the gap between the 1% and the 99% even wider.
Studies show that most US citizens don't realize how unequal wealth distribution is. They would prefer a more equal distribution.
| Year | Bottom 99% |
Top 1% |
|---|---|---|
| 1922 | 63.3% | 36.7% |
| 1929 | 55.8% | 44.2% |
| 1933 | 66.7% | 33.3% |
| 1939 | 63.6% | 36.4% |
| 1945 | 70.2% | 29.8% |
| 1949 | 72.9% | 27.1% |
| 1953 | 68.8% | 31.2% |
| 1962 | 68.2% | 31.8% |
| 1965 | 65.6% | 34.4% |
| 1969 | 68.9% | 31.1% |
| 1972 | 70.9% | 29.1% |
| 1976 | 80.1% | 19.9% |
| 1979 | 79.5% | 20.5% |
| 1981 | 75.2% | 24.8% |
| 1983 | 69.1% | 30.9% |
| 1986 | 68.1% | 31.9% |
| 1989 | 64.3% | 35.7% |
| 1992 | 62.8% | 37.2% |
| 1995 | 61.5% | 38.5% |
| 1998 | 61.9% | 38.1% |
| 2001 | 66.6% | 33.4% |
| 2004 | 65.7% | 34.3% |
| 2007 | 65.4% | 34.6% |
| 2010 | 64.6% | 35.4% |
How Wealth Becomes Concentrated
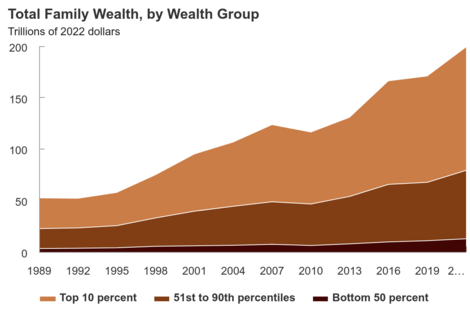
Wealth concentration is when wealth gathers in the hands of a few people or groups. Those who already have wealth can invest it to make even more wealth. This helps them get richer.
Economic Factors in Wealth Concentration
For wealth to become concentrated, two main things are needed. First, wealth must already be unevenly distributed. Second, this small difference must grow bigger over time. This is like a positive feedback loop in economics. Studies show that even by chance, wealth can become very concentrated, with a few people owning almost 100% of it.
Being Rich and Earning More
Several ideas explain why wealth gets concentrated:
- Being rich helps you earn more: Wealthy people might have better chances for high-paying jobs, like going to top schools.
- Earning more helps you get rich: People with high incomes can save more, which helps them build wealth.
- Rich people can influence rules: Wealthy people might use their influence to change laws in ways that benefit them, increasing their wealth even more. An example is how political campaigns are funded in some countries.
These reasons can work together, making wealth concentration even stronger. Some experts believe that the very rich are "waging class warfare" on the rest of society, and they are winning.
How Governments Can Affect Wealth Distribution
Many societies have tried to redistribute wealth. This can be done through property redistribution, taxation, or regulation. Sometimes, this is to help the rich, and other times it's to reduce economic inequality.
For example, in ancient Rome, laws were made to limit how much land one family could own. Reasons for limiting wealth include wanting everyone to have a fair chance, fearing that too much wealth leads to corruption, or trying to gain political support. Different forms of socialism aim to reduce unequal wealth distribution and the problems it causes.
During the Age of Enlightenment, Francis Bacon wrote that it's good policy for money not to be "gathered into a few hands." He said, "Money is like fertilizer, not good except it be spread."
The rise of Communism was partly due to extreme wealth differences. A few people lived in luxury, while many lived in extreme poverty. However, in modern times, a mix of labor movements, new technology, and social liberalism has reduced extreme poverty in many developed countries. Still, big differences between rich and poor remain in some parts of the world.
The World Economic Forum's 2014 report listed widening income differences as a major global risk. Studies also show that countries with high income inequality and weak support for the unemployed often have worse mental health outcomes for those without jobs.
See also
- Wealth inequality in the United States
- Wealth distribution in Europe
- Distributive justice
- Gini coefficient
- Social mobility
- Economic inequality
- List of countries by wealth inequality
 | Ernest Everett Just |
 | Mary Jackson |
 | Emmett Chappelle |
 | Marie Maynard Daly |


