
Jurupa Valley, California facts for kids
Quick facts for kids
Jurupa Valley, California
|
||
|---|---|---|
 |
||
|
||
| Nickname(s):
"Jurupa"
|
||

Location of Jurupa Valley in Riverside County, California.
|
||

Jurupa Valley, California
Location in southern California

Jurupa Valley, California
Location in California

Jurupa Valley, California
Location in the United States
|
||
| Country | ||
| State | ||
| County | Riverside | |
| Incorporated (city) | July 1, 2011 | |
| Government | ||
| • Type | Council–manager | |
| Area | ||
| • City | 43.68 sq mi (113.13 km2) | |
| • Land | 42.94 sq mi (111.22 km2) | |
| • Water | 0.74 sq mi (1.91 km2) | |
| Population
(2020)
|
||
| • City | 105,053 | |
| • Rank | 6th in Riverside County 64th in California 304th in the United States |
|
| • Density | 2,446.51/sq mi (944.60/km2) | |
| • Metro | 4,527,837 | |
| Time zone | UTC−8 (PST) | |
| • Summer (DST) | UTC−7 (PDT) | |
| ZIP codes |
91752, 92509
|
|
| Area code(s) | 951 | |
| FIPS code | 06-37692 | |
| GNIS feature ID | 2702867 | |

Jurupa Valley is a city in the northwest part of Riverside County, California, United States. It was one of the first non-native settlements in the county. This area was once part of Rancho Jurupa, a large land grant from Mexico in 1838. The city's name comes from a Native American village that was here before Europeans arrived.
On March 8, 2011, people living in the area voted to make Jurupa Valley an official city. This happened on July 1, 2011. Before this, in 1992, residents had voted against becoming a city. Jurupa Valley was the newest city in California until 2024.
The city of Jurupa Valley is about 43.5 square miles (113 square kilometers) big. In 2020, about 105,053 people lived there. It is next to cities like Eastvale, Norco, and Riverside in Riverside County. It also borders cities in San Bernardino County.
Contents
Exploring Jurupa Valley's Past
The land where Jurupa Valley now stands was first home to the Gabrielino and Serrano Native American tribes.

What Does "Jurupa" Mean?
The name "Jurupa" comes from the Mexican land grant called Rancho Jurupa. This rancho was named after a Native American village in the area. The Serrano and Gabrieleño people lived in this village. The Gabrieleño called it Jurungna or Hurungna.
The exact meaning of "Jurupa" is not fully known. Some old books say it was a greeting meaning "peace and friendship." Others suggest it came from "Jurumpa," meaning "watering place." More recent studies think it might refer to Juru, which is the California sagebrush plant. This plant is very common in the area.
Becoming a City: Jurupa Valley's Incorporation Journey
In 1992, people in the area first voted on becoming a city. This idea was rejected by most voters. They also voted on how city council members would be chosen and what the city's name would be if it incorporated.
On March 8, 2011, a second vote took place. This time, 54% of voters said yes to becoming a city. Jurupa Valley officially became a city on July 1, 2011. At that time, about 88,000 people lived in the new city. It included communities like Mira Loma, Glen Avon, and Rubidoux.
After becoming a city, Jurupa Valley faced money problems. The State of California changed how it shared vehicle license fees with cities. This made it hard for Jurupa Valley to pay for services. For a few years, the city struggled. In 2015, new laws were passed to help Jurupa Valley and other new cities get the money they needed.
People and Community in Jurupa Valley
| Historical population | |||
|---|---|---|---|
| Census | Pop. | %± | |
| 2020 | 105,053 | — | |
| U.S. Decennial Census | |||
Jurupa Valley became a city in 2011. It was formed by joining nine communities. These include Belltown, Crestmore Heights, Glen Avon, Indian Hills, Jurupa Hills, Pedley, Rubidoux, Sunnyslope, and Mira Loma.
Who Lives in Jurupa Valley?
| Race / Ethnicity (NH = Non-Hispanic) | Pop 2020 | % 2020 |
|---|---|---|
| White alone (NH) | 19,187 | 18.26% |
| Black or African American alone (NH) | 3,529 | 3.36% |
| Native American or Alaska Native alone (NH) | 240 | 0.23% |
| Asian alone (NH) | 5,281 | 5.03% |
| Pacific Islander alone (NH) | 237 | 0.23% |
| Other Race alone (NH) | 534 | 0.51% |
| Mixed Race or Multi-Racial (NH) | 1,998 | 1.90% |
| Hispanic or Latino (any race) | 74,407 | 70.49% |
| Total | 105,053 | 100.00% |
According to the United States Census Bureau, in 2020, the population of Jurupa Valley was 105,053. About 71.4% of the people were Hispanic or Latino. About 20.6% were White (not Hispanic). Other groups included Black or African American (3.2%), Asian (3.6%), and people of two or more races (3.6%).
Learning and Schools in Jurupa Valley
Jurupa Valley has its own school system called the Jurupa Unified School District. This district runs many schools for students of all ages.
- Seventeen elementary schools
- Four middle schools
- Two continuation schools
- Three high schools:
- Jurupa Valley High School
- Rubidoux High School
- Patriot High School
A small part of Jurupa Valley is also served by the Corona-Norco Unified School District.

Getting Around Jurupa Valley
Public transportation in Jurupa Valley is provided by the Riverside Transit Agency. You can also take the train from Jurupa Valley/Pedley station. This station is served by Metrolink trains.
Jurupa Valley has a small airport called Flabob Airport. It is used for private planes. For bigger commercial flights, people use the nearby Ontario International Airport.
The main highways in Jurupa Valley are Interstate 15 and California State Route 60. Interstate 15 runs along the city's western edge. State Route 60 goes along the northern side of the city.

Fun and Recreation in Jurupa Valley
Jurupa Valley offers many places for fun and outdoor activities.
- Galleano Winery
- Jensen Alvarado Ranch
- Jurupa Mountains Discovery Center
- Rancho Jurupa Regional Park
- The Cove Waterpark
- Golf courses:
- Goose Creek Golf Club
- Indian Hills Country Club
- Jurupa Hills Country Club
- Oak Quarry Golf Club
Understanding Jurupa Valley's Geography
Jurupa Valley is located north and west of the Santa Ana River. It is across the river from Riverside, California. The city is south of the border between Riverside and San Bernardino counties. It is also east of Interstate 15.
The city is made up of nine different neighborhoods or communities:
- Belltown
- Crestmore Heights
- Glen Avon
- Indian Hills
- Jurupa Hills
- Pedley
- Rubidoux
- Sunnyslope
- Mira Loma
Jurupa Valley's Climate
| Climate data for Jurupa Valley, California | |||||||||||||
|---|---|---|---|---|---|---|---|---|---|---|---|---|---|
| Month | Jan | Feb | Mar | Apr | May | Jun | Jul | Aug | Sep | Oct | Nov | Dec | Year |
| Record high °F (°C) | 91 (33) |
92 (33) |
100 (38) |
101 (38) |
107 (42) |
110 (43) |
110 (43) |
112 (44) |
115 (46) |
108 (42) |
99 (37) |
92 (33) |
115 (46) |
| Mean daily maximum °F (°C) | 67 (19) |
68 (20) |
71 (22) |
77 (25) |
80 (27) |
88 (31) |
93 (34) |
95 (35) |
91 (33) |
83 (28) |
74 (23) |
69 (21) |
80 (27) |
| Mean daily minimum °F (°C) | 42 (6) |
44 (7) |
46 (8) |
48 (9) |
53 (12) |
58 (14) |
64 (18) |
66 (19) |
62 (17) |
53 (12) |
45 (7) |
42 (6) |
52 (11) |
| Record low °F (°C) | 24 (−4) |
27 (−3) |
28 (−2) |
31 (−1) |
32 (0) |
44 (7) |
49 (9) |
48 (9) |
42 (6) |
31 (−1) |
26 (−3) |
23 (−5) |
22 (−6) |
| Average precipitation inches (mm) | 3.45 (88) |
3.62 (92) |
2.91 (74) |
.88 (22) |
.26 (6.6) |
.03 (0.76) |
.05 (1.3) |
.15 (3.8) |
.27 (6.9) |
.56 (14) |
1.34 (34) |
2.72 (69) |
16.24 (412) |
| Average precipitation days | 6.6 | 7.2 | 5.3 | 3.5 | 1.4 | 0.3 | 0.8 | 1.0 | 1.3 | 2.5 | 4.4 | 6.4 | 40.7 |
Images for kids
-
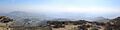
Jurupa Valley as seen from the Jurupa Hills, 2015
See also
 In Spanish: Jurupa Valley para niños
