San Bernardino County, California facts for kids
Quick facts for kids
San Bernardino County, California
|
|||
|---|---|---|---|
|
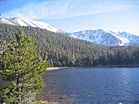
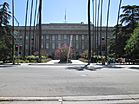
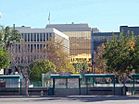
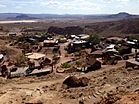
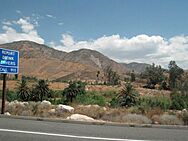
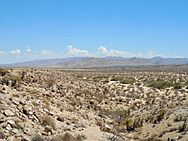
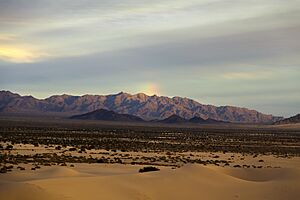
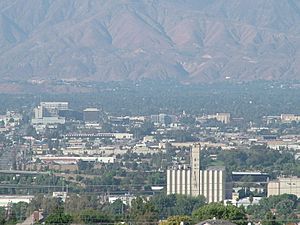
Images, from top down, left to right: A view of the San Bernardino Mountains range from San Gorgonio Wilderness, San Bernardino County Court House, Downtown San Bernardino, Calico ghost town, snowfall in Yucca Valley, sunrise in Hesperia
|
|||
|
|||
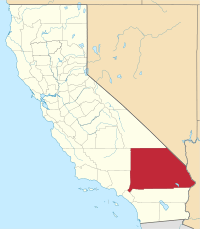
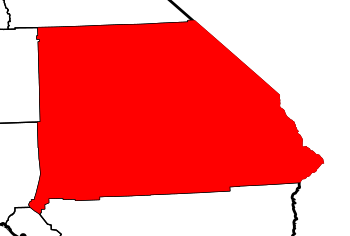
Location in California
|
|||
| Country | United States | ||
| State | California | ||
| Established | April 26, 1853 | ||
| Named for | The City of San Bernardino, in turn named for San Bernardino de Sena Estancia, in turn named for Saint Bernardino of Siena | ||
| County seat | San Bernardino | ||
| Largest city (Pop.) | San Bernardino | ||
| Largest city (Area) | Apple Valley | ||
| Government | |||
| • Type | Council–CEO | ||
| • Body | Board of Supervisors | ||
| Area | |||
| • Total | 20,105 sq mi (52,070 km2) | ||
| • Land | 20,057 sq mi (51,950 km2) | ||
| • Water | 48 sq mi (120 km2) | ||
| Highest elevation | 11,503 ft (3,506 m) | ||
| Population
(2020)
|
|||
| • Total | 2,181,654 | ||
| • Estimate
(2023)
|
2,195,611 |
||
| • Density | 108.5130/sq mi (41.8971/km2) | ||
| GDP | |||
| • Total | $100.650 billion (2022) | ||
| Time zone | UTC−8 (Pacific Time Zone) | ||
| • Summer (DST) | UTC−7 (Pacific Daylight Time) | ||
| Area codes | 442/760, 909, 951 | ||
| FIPS code | 06-071 | ||
| Congressional districts | 23rd, 25th, 28th, 33rd, 35th, 40th | ||
San Bernardino County is a large county in Southern California. It is part of the Inland Empire area. In 2020, over 2.1 million people lived here. This makes it the fifth most populated county in California. It is also the 14th most populated county in the United States. The main city, or county seat, is San Bernardino.
San Bernardino County is part of the larger Greater Los Angeles area. It is also included in the Riverside–San Bernardino–Ontario metropolitan area.
This county is huge! It covers about 20,105 square miles. This makes it the largest county in the mainland United States. It's almost as big as the entire state of West Virginia. It is also similar in size to the country of Bosnia and Herzegovina.
Most of the county's people live in three main areas. These are Fontana, San Bernardino, and Victorville-Hesperia. These areas cover about 1,730 square miles. The rest of the county is mostly thinly populated deserts and mountains. The county stretches from the San Bernardino Valley to the Nevada border. It also reaches the Colorado River.
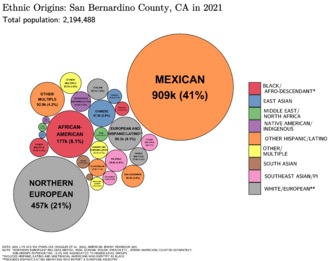
In 2020, about 53.7% of the people in the county were Hispanic. This makes it California's most populated county with a majority Hispanic population. It is the second largest nationwide.
Contents
History of San Bernardino County
Early Indigenous Peoples

Many different Native American groups lived in what is now San Bernardino County. These included the Taaqtam (Serrano) and ʔívil̃uqaletem (Cahuilla) peoples. They lived in the San Bernardino Valley and the San Bernardino Mountains. The Chemehuevi and Kawaiisu peoples lived in the Mojave Desert. The 'Aha Makhav (Mohave) and Piipaash (Maricopa) peoples lived along the Colorado River.
These groups built many villages and settlements. They were all connected by a large network of trails. Wa'aachnga was a big Tongva village. It was also home to the Serrano and Cahuilla people. This village was near what is now the city of San Bernardino. It was part of a trade network along the Mohave Trail. This trail connected villages from the Colorado River to the Los Angeles Basin. Wá'peat was a Desert Serrano village near Hesperia. It was one of many villages along the Mojave River. By the late 1700s, Spanish soldiers and missionaries began to move into the area. They came from Mission San Gabriel Arcángel.
Spanish Colonial Period
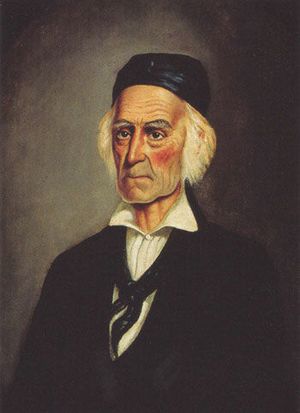
Spanish missionaries from Mission San Gabriel Arcángel built a church at the village of Wa'aachnga. They renamed it Politania in 1810. Father Francisco Dumetz named the church San Bernardino on May 20, 1810. This was the feast day of Saint Bernardino of Siena. The Franciscans also named the snow-capped peak in Southern California after the saint. This is where the county gets its name. In 1819, they built the San Bernardino de Sena Estancia. This was a mission farm in what is now Redlands.
After Mexico became independent from Spain in 1821, Mexican citizens received land grants. They used these grants to create large farms called ranchos. These included Rancho Jurupa (1838), Rancho Cucamonga (1839), El Rincon (1839), Rancho Santa Ana del Chino (1841), Rancho San Bernardino (1842), and Rancho Muscupiabe (1844).
Agua Mansa was the first town in the area that became San Bernardino County. It was settled in 1841 by people from New Mexico. They built it on land given from the Rancho Jurupa.
Forming the County

In 1851, Mormon settlers bought Rancho San Bernardino. They then founded the town of San Bernardino. San Bernardino County was officially created in 1853. It was formed from parts of Los Angeles County. Later, in 1893, some southern parts of the county became part of Riverside County.
Geography and Landscapes
San Bernardino County covers about 20,105 square miles. Most of this is land (20,057 sq mi), with a small amount of water (48 sq mi). It is the largest county in California by area. It is also the largest in the entire United States, not counting Alaska. It is bigger than the states of New Jersey, Connecticut, Delaware, and Rhode Island combined. It is also slightly larger than Switzerland. The county shares borders with Nevada and Arizona.
Most of the population, nearly two million people, live in the southwestern part of the county. This area is south of the San Bernardino Mountains. It includes the San Bernardino Valley. About 390,000 people live north of the San Bernardino Mountains. This area is called the Victor Valley. It includes cities like Adelanto, Apple Valley, Hesperia, and Victorville. Around 100,000 more people live spread out across the rest of the county.
The Mojave National Preserve covers parts of the eastern desert. This area is between Interstate 15 and Interstate 40. The desert also includes cities like Needles by the Colorado River. Barstow is at the meeting point of Interstate 15 and Interstate 40. Trona is in the northwest, west of Death Valley. A small part of Death Valley National Park is in San Bernardino County. A part of Joshua Tree National Park is also in the county, near Twentynine Palms. Other towns in the High Desert include Pioneertown, Yucca Valley, Joshua Tree, Landers, and Morongo Valley.
The mountains are home to the San Bernardino National Forest. Communities there include Crestline, Lake Arrowhead, Running Springs, Big Bear City, Forest Falls, and Big Bear Lake.
The San Bernardino Valley is at the eastern end of the San Gabriel Valley. Cities in the San Bernardino Valley include Ontario, Chino, Chino Hills, Upland, Fontana, Rialto, Colton, Grand Terrace, Montclair, Rancho Cucamonga, San Bernardino, Loma Linda, Highland, Redlands, and Yucaipa.
Neighboring Counties
|
|
San Bernardino County shares borders with many other counties and states. To the north is Inyo County. To the northeast is Clark County, Nevada. To the east is Mohave County, Arizona. To the southeast is La Paz County, Arizona. To the south is Riverside County. To the southwest is Orange County. To the west is Los Angeles County. And to the northwest is Kern County. |
Protected Natural Areas
A large part of San Bernardino County's land is protected. Over 80% of the county's land is owned by the federal government. There are at least 35 official wilderness areas here. This is the most of any county in the United States. Most of these areas are managed by the Bureau of Land Management. Some are part of larger national parks or forests.
These protected areas include:
- Angeles National Forest (part)
- Death Valley National Park (part)
- Havasu National Wildlife Refuge (part)
- Joshua Tree National Park (part)
- Mojave National Preserve
- San Bernardino National Forest (part)
- Sand to Snow National Monument (part)
Many wilderness areas are also found here:
- Bigelow Cholla Garden Wilderness
- Bighorn Mountain Wilderness (part)
- Black Mountain Wilderness
- Bristol Mountains Wilderness
- Cadiz Dunes Wilderness
- Chemehuevi Mountains Wilderness
- Cleghorn Lakes Wilderness
- Clipper Mountain Wilderness
- Cucamonga Wilderness
- Dead Mountains Wilderness
- Death Valley Wilderness (part)
- Golden Valley Wilderness
- Grass Valley Wilderness
- Havasu Wilderness (part)
- Hollow Hills Wilderness
- Joshua Tree Wilderness (part)
- Kelso Dunes Wilderness
- Kingston Range Wilderness
- Mesquite Wilderness
- Mojave Wilderness
- Newberry Mountains Wilderness
- North Mesquite Mountains Wilderness
- Old Woman Mountains Wilderness
- Pahrump Valley Wilderness (part)
- Piute Mountains Wilderness
- Rodman Mountains Wilderness
- Saddle Peak Hills Wilderness (part)
- San Gorgonio Wilderness (part)
- Sheep Mountain Wilderness (part)
- Sheephole Valley Wilderness
- Stateline Wilderness
- Stepladder Mountains Wilderness
- Trilobite Wilderness
- Turtle Mountains Wilderness
- Whipple Mountains Wilderness
Population and People
Population Changes Over Time
| Historical population | |||
|---|---|---|---|
| Census | Pop. | %± | |
| 1860 | 5,551 | — | |
| 1870 | 3,988 | −28.2% | |
| 1880 | 7,786 | 95.2% | |
| 1890 | 25,497 | 227.5% | |
| 1900 | 27,929 | 9.5% | |
| 1910 | 56,706 | 103.0% | |
| 1920 | 73,401 | 29.4% | |
| 1930 | 133,900 | 82.4% | |
| 1940 | 161,108 | 20.3% | |
| 1950 | 281,642 | 74.8% | |
| 1960 | 503,591 | 78.8% | |
| 1970 | 684,072 | 35.8% | |
| 1980 | 895,016 | 30.8% | |
| 1990 | 1,418,380 | 58.5% | |
| 2000 | 1,709,434 | 20.5% | |
| 2010 | 2,035,210 | 19.1% | |
| 2020 | 2,181,654 | 7.2% | |
| 2023 (est.) | 2,195,611 | 7.9% | |
| U.S. Decennial Census 1790–1960 1900–1990 1990–2000 2010 2020 |
|||
The population of San Bernardino County has grown a lot over the years. In 1860, there were only 5,551 people. By 2020, the population had grown to 2,181,654. The county is still growing, with an estimated 2,195,611 people in 2023.
Diversity in San Bernardino County (2020)
San Bernardino County is very diverse. The 2020 Census showed that many different groups live here.
- About 25.95% of people were White (not Hispanic).
- About 7.94% were Black or African American (not Hispanic).
- About 0.39% were Native American (not Hispanic).
- About 8.08% were Asian (not Hispanic).
- About 0.28% were Pacific Islander (not Hispanic).
- About 0.56% were another race (not Hispanic).
- About 3.14% were of two or more races (not Hispanic).
- A large group, about 53.67%, were Hispanic or Latino (of any race).
This shows that more than half of the county's population is Hispanic or Latino.
Life in the County (2000)
In 2000, there were 1,709,434 people living in the county. There were 528,594 households, which are groups of people living together. Most households (55.8%) were married couples. About 43.7% of households had children under 18. The average household had 3.2 people.
The median income for a household was $42,066. This means half of the households earned more, and half earned less. For families, the median income was $46,574. The average income per person was $16,856. About 15.8% of the population lived below the poverty line. This included 20.6% of children under 18.
Education and Learning
San Bernardino County has many places to learn.
Colleges and Universities
There are several colleges and universities in the county:
- Barstow Community College
- California State University, San Bernardino
- California University of Science and Medicine
- Chaffey College
- Copper Mountain College
- Crafton Hills College
- Loma Linda University
- San Bernardino Valley College
- University of Redlands
- Victor Valley College
Schools for Kids (K-12)
The county has many school districts. They help kids from kindergarten through 12th grade.
- Unified School Districts (K-12):
- Apple Valley Unified School District
- Baker Valley Unified School District
- Barstow Unified School District
- Bear Valley Unified School District
- Chino Valley Unified School District
- Colton Joint Unified School District
- Fontana Unified School District
- Hesperia Unified School District
- Lucerne Valley Unified School District
- Morongo Unified School District
- Needles Unified School District
- Redlands Unified School District
- Rialto Unified School District
- Rim of the World Unified School District
- San Bernardino City Unified School District
- Sierra Sands Unified School District
- Silver Valley Unified School District
- Snowline Joint Unified School District
- Trona Joint Unified School District
- Upland Unified School District
- Yucaipa-Calimesa Joint Unified School District
- High School Districts:
- Chaffey Joint Union High School District
- Victor Valley Union High School District
- Elementary School Districts:
- Adelanto Elementary School District
- Alta Loma Elementary School District
- Central Elementary School District
- Cucamonga Elementary School District
- Etiwanda Elementary School District
- Helendale Elementary School District
- Mountain View Elementary School District
- Mount Baldy Joint Elementary School District
- Ontario-Montclair School District
- Oro Grande Elementary School District
- Victor Elementary School District
Libraries for Everyone
The San Bernardino County Library System has 32 branches. They offer many services. These include internet access, story times for kids, and book clubs. They also have e-books, digital music, and movies.
Some cities in the county have their own public libraries. These include the A. K. Smiley Public Library in Redlands, California, built in 1898. Other city libraries are in San Bernardino City, Rancho Cucamonga, Upland, Colton, Victorville, and Ontario. These city libraries are separate from the county system.
Arts and Culture in San Bernardino County
The San Bernardino County Museum in Redlands is a great place to learn about the area's history. It has exhibits on the culture and nature of San Bernardino County.
Keys Desert Queen Ranch is in Joshua Tree National Park. You can take tours to learn about its history. This includes Native American history, mining, and ranching.
Kimberly Crest House & Gardens is a beautiful 6-acre estate in Redlands. It has a Victorian Chateau and Italian Renaissance gardens. The gardens are open to the public. The house is a museum with guided tours.
The Wignall Museum of Contemporary Art is at Chaffey College in Rancho Cucamonga. It shows temporary exhibits of modern art. It also offers educational programs for the community.
Getting Around: Transportation
Main Roads
Many important highways run through San Bernardino County. These roads help people travel across the large county.
Public Transport Options
You can use public transportation to get around the county:
- Morongo Basin Transit Authority offers bus service in Yucca Valley, Joshua Tree, and Twentynine Palms.
- Mountain Transit covers the Lake Arrowhead and Big Bear areas.
- Needles Area Transit serves Needles and nearby areas.
- Omnitrans provides bus service in the more populated parts of the county. This includes San Bernardino and areas between Montclair and Yucaipa.
- Victor Valley Transit Authority runs buses in Victorville, Hesperia, Adelanto, and Apple Valley.
- Foothill Transit connects the Inland Empire to Los Angeles.
- RTA connects Montclair to Riverside County.
- SunLine Transit Agency connects Cal State San Bernardino to Palm Springs.
- Beaumont Transit connects Downtown San Bernardino to Beaumont and Banning.
- You can also travel by Greyhound buses and Amtrak trains.
- Metrolink commuter trains connect the county to Los Angeles, Orange, and Riverside Counties.
Airports in the County
There are several airports in San Bernardino County:
- San Bernardino International Airport (SBD) and Ontario International Airport (ONT) offer commercial flights.
- Southern California Logistics Airport (Victorville) is used for general aviation. It is also a place where old airplanes are stored.
- The county owns six smaller airports for general aviation. These are Apple Valley Airport, Baker Airport, Barstow-Daggett Airport, Chino Airport, Needles Airport, and Twentynine Palms Airport.
- Other general aviation airports include Big Bear City Airport, Cable Airport (Upland), Hesperia Airport, and Redlands Municipal Airport.
Environmental Quality
San Bernardino County has faced challenges with air quality. In 2007, the state sued the county. This was because the county's growth plan did not fully consider the effects of global warming. Environmental groups also filed lawsuits. They wanted the county to measure greenhouse gases and work to reduce them.
The county and the state reached an agreement in 2007. The county agreed to create a plan to reduce greenhouse gas emissions. This plan would include setting targets for reductions. In 2015, San Bernardino County had high levels of ozone (smog). This was the highest in the United States.
Communities in San Bernardino County
San Bernardino County has many different cities and towns.
Cities in the County
| City | Year incorporated |
Population, 2018 |
Median income, 2019 |
Land area sq mi (km2) |
|---|---|---|---|---|
| Adelanto | 1970 | 34,160 | $45,380 | 56.009 (145.062) |
| Apple Valley | 1988 | 73,508 | $51,314 | 73.193 (189.57) |
| Barstow | 1947 | 23,972 | $40,633 | 41.385 (107.186) |
| Big Bear Lake | 1981 | 5,281 | $51,060 | 6.346 (16.435) |
| Chino | 1910 | 91,583 | $87,090 | 29.639 (76.766) |
| Chino Hills | 1991 | 83,447 | $103,473 | 44.681 (115.723) |
| Colton | 1887 | 54,741 | $53,838 | 15.324 (39.689) |
| Fontana | 1952 | 213,739 | $80,800 | 42.432 (109.899) |
| Grand Terrace | 1978 | 12,584 | $71,788 | 3.502 (9.07) |
| Hesperia | 1988 | 95,274 | $50,271 | 73.096 (189.316) |
| Highland | 1987 | 55,406 | $64,868 | 18.755 (48.575) |
| Loma Linda | 1970 | 24,382 | $55,607 | 7.516 (19.467) |
| Montclair | 1956 | 39,437 | $62,024 | 5.517 (14.289) |
| Needles | 1913 | 4,982 | $33,717 | 30.808 (79.793) |
| Ontario | 1891 | 181,107 | $75,266 | 49.941 (129.345) |
| Rancho Cucamonga | 1977 | 177,751 | $92,773 | 39.851 (103.212) |
| Redlands | 1888 | 71,586 | $72,410 | 36.126 (93.565) |
| Rialto | 1911 | 103,440 | $70,188 | 22.351 (57.889) |
| San Bernardino | 1854 | 215,941 | $49,721 | 59.201 (153.33) |
| Twentynine Palms | 1987 | 26,418 | $44,226 | 59.143 (153.179) |
| Upland | 1906 | 77,000 | $82,426 | 15.617 (40.448) |
| Victorville | 1962 | 122,312 | $60,391 | 73.178 (189.529) |
| Yucaipa | 1989 | 53,682 | $69,104 | 27.888 (72.231) |
| Yucca Valley | 1991 | 21,726 | $44,757 | 40.015 (103.639) |
Census-Designated Places (CDPs)
These are areas that are like towns but are not officially incorporated as cities.
- Baker
- Big Bear City
- Big River
- Bloomington
- Bluewater
- Crestline
- Fort Irwin
- Homestead Valley
- Joshua Tree
- Lake Arrowhead
- Lenwood
- Lucerne Valley
- Lytle Creek
- Mentone
- Morongo Valley
- Mountain View Acres
- Muscoy
- Oak Glen
- Oak Hills
- Phelan
- Piñon Hills
- Running Springs
- San Antonio Heights
- Searles Valley
- Silver Lakes
- Spring Valley Lake
- Wrightwood
- Yermo
Unincorporated Communities
These are smaller communities that are not part of any city or CDP.
- Amboy
- Angelus Oaks
- Argus
- Arrowbear Lake
- Arrowhead Farms
- Arrowhead Highlands
- Arrowhead Junction
- Baldwin Lake
- Baldy Mesa
- Bell Mountain
- Blue Jay
- Bryman
- Cadiz
- Cajon Junction
- Cedar Glen
- Cedarpines Park
- Cima
- Crafton
- Crest Park
- Cushenbury
- Daggett
- Danby
- Earp
- El Mirage
- Essex
- Fawnskin
- Fenner
- Forest Falls
- Goffs
- Green Valley Lake
- Halloran Springs
- Havasu Lake
- Helendale
- Hinkley
- Hodge
- Johnson Valley
- Kingston
- Kramer
- Kramer Hills
- La Delta
- Landers
- Ludlow
- Mars
- Midway
- Mojave Heights
- Mount Baldy
- Mountain Home Village
- Mountain Pass
- Narod
- Newberry Springs
- Nipton
- Oro Grande
- Parker Dam
- Patton
- Pioneer Point
- Pioneertown
- Red Mountain
- Rimforest
- Skyforest
- Sugarloaf
- Sunfair
- Sunfair Heights
- Trona
- Twentynine Palms Base
- Twin Peaks
- Venus
- Vidal
- Vidal Junction
- Wonder Valley
- Zzyzx
Indian Reservations
These are lands set aside for Native American tribes:
- Chemehuevi Indian Reservation
- Colorado River Indian Reservation (partially in Riverside County, and La Paz County, Arizona)
- Fort Mojave Indian Reservation (partially in Mohave County, Arizona, and Clark County, Nevada)
- San Manuel Indian Reservation
- Twenty-Nine Palms Indian Reservation (partially in Riverside County)
Ghost Towns
These are towns that used to be busy but are now mostly empty:
Fun Places to Visit
- Calico Ghost Town — a historic mining town you can explore. It's northeast of Barstow.
- Zzyzx — a small desert spot that was once a health spa. Now it's a research center.
- Downtown San Bernardino — the heart of the county seat.
- Mojave Narrows Park — a regional park with lakes and trails.
- Mojave National Preserve — a large protected desert area with unique landscapes.
- Mojave Trails National Monument — another vast desert monument.
- Joshua Tree National Park — famous for its unique Joshua trees and rock formations.
- Castle Mountains National Monument — a beautiful area with mountains and wildlife.
- Sand to Snow National Monument — a diverse area stretching from desert to mountains.
- San Bernardino National Forest — a great place for outdoor activities. It includes Big Bear Lake.
- Goldstone Deep Space Communications Complex — a NASA facility that communicates with spacecraft.
- Mitchell Caverns — limestone caves to explore.
- Snow Summit, Bear Mountain (Ski Area), and Snow Valley Mountain Resort — top winter ski resorts in Southern California.
- The Pacific Crest Trail — a famous long-distance hiking trail that passes through the county.
See also
 In Spanish: Condado de San Bernardino para niños
 | Roy Wilkins |
 | John Lewis |
 | Linda Carol Brown |


