Bridgeport, California facts for kids
Quick facts for kids
Bridgeport, California
|
|
|---|---|
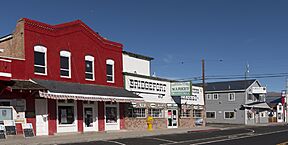
Main Street
|
|
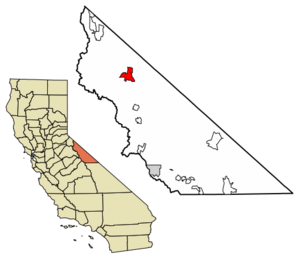
Location in Mono County and the state of California
|
|
| Country | United States |
| State | California |
| County | Mono |
| Area | |
| • Total | 21.75 sq mi (56.33 km2) |
| • Land | 21.74 sq mi (56.31 km2) |
| • Water | 0.01 sq mi (0.02 km2) 0.04% |
| Elevation | 6,598 ft (2,011 m) |
| Population
(2020)
|
|
| • Total | 553 |
| • Density | 25.4/sq mi (9.8/km2) |
| Time zone | UTC-8 (Pacific) |
| • Summer (DST) | UTC-7 (PDT) |
| ZIP code |
93517
|
| Area codes | 442/760 |
| GNIS feature IDs | 2582950 |
Bridgeport is a small town in Mono County, California, United States. It is the main town and center of government for Mono County. In 2020, about 553 people lived there.
Bridgeport got its first post office in 1864. The town's ZIP code is 93517.
Contents
Where is Bridgeport Located?
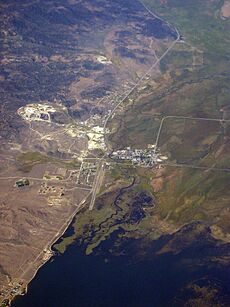
Bridgeport is in the northwestern part of Mono County. It sits in a valley called the Bridgeport Valley. This valley is surrounded by tall mountains. To the west are the Sierra Nevada mountains. To the north are the Sweetwater Mountains, and to the east are the Bodie Hills.
The town's center is where two main roads meet: U.S. Route 395 and State Route 182. Route 395 goes south about 50 miles (80 km) to Mammoth Lakes. It goes northwest about 81 miles (130 km) to Carson City, Nevada. State Route 182 goes northeast about 13 miles (21 km) to the border of Nevada.
Bridgeport covers an area of about 56.3 km2 (21.7 sq mi). Most of this area is land. A small part is water. The Bridgeport Reservoir, a lake on the East Walker River, is on the northwest side of the town. The US Marine Corps' Mountain Warfare Training Center is about 20 miles (32 km) west of Bridgeport.
Who Lives in Bridgeport?
In 2010, Bridgeport had a population of 575 people. Most people lived in homes. A small number of people lived in special institutions.
The town had 257 households. About 26% of these homes had children under 18. The average household had about 2 people. The average family had about 2.8 people.
The population included people of different ages. About 20% were under 18 years old. About 17% were 65 years or older. The average age in Bridgeport was about 45.5 years old.
Fun Things to Do in Bridgeport
Bridgeport used to be called Big Meadows. Many thousands of visitors come here every year. They especially love the area for its great trout fishing.
You can find trout in many places around Bridgeport. These include Bridgeport Reservoir, Twin Lakes, Virginia Lakes, Green Creek, the East Walker River, and the West Walker River. There are also many smaller streams and lakes in the backcountry. You can catch rainbow, brown, and cutthroat trout. The Bridgeport Fish Enhancement Program even holds fishing contests twice a year.
Bridgeport is also popular for winter fun. There are over 500 miles of trails for cross-country skiing, snowshoeing, and snowmobiling. You can also go dogsledding. Many areas are great for telemarking and cross-country downhill skiing.
Bridgeport is close to the famous ghost town of Bodie. Bodie is a well-preserved old mining town. The Mono County Courthouse in Bridgeport is a historic building. It is listed on the National Register of Historic Places.
Bridgeport's Weather
Bridgeport has a climate with cold, snowy winters. Summers are dry with warm days and cool mornings.
In January, the average high temperature is about 43.2 °F (6.2 °C). The average low is about 10.3 °F (−12.1 °C). In July, the average high is about 84.9 °F (29.4 °C). The average low is about 43.4 °F (6.3 °C).
It gets very cold at night because of the high altitude. On average, there are 243 mornings a year when the temperature drops below 32 °F (0.0 °C). About 17 mornings a year, it gets colder than 0 °F (−17.8 °C). The hottest temperature ever recorded was 98 °F (36.7 °C) in July 2002. The coldest was −37 °F (−38.3 °C) in January 1937.
Bridgeport gets about 10.19 inches (258.8 mm) of rain and snow each year. It snows about 31.9 inches (0.81 m) on average each year. The snowiest year was 1916, with 166.0 inches (4.22 m) of snow.
| Climate data for Bridgeport, California, 1991–2020 normals, extremes 1906–present | |||||||||||||
|---|---|---|---|---|---|---|---|---|---|---|---|---|---|
| Month | Jan | Feb | Mar | Apr | May | Jun | Jul | Aug | Sep | Oct | Nov | Dec | Year |
| Record high °F (°C) | 68 (20) |
71 (22) |
77 (25) |
84 (29) |
88 (31) |
94 (34) |
98 (37) |
96 (36) |
94 (34) |
89 (32) |
85 (29) |
72 (22) |
98 (37) |
| Mean maximum °F (°C) | 56.1 (13.4) |
58.3 (14.6) |
65.6 (18.7) |
74.3 (23.5) |
79.2 (26.2) |
87.1 (30.6) |
92.1 (33.4) |
90.2 (32.3) |
85.8 (29.9) |
79.3 (26.3) |
70.0 (21.1) |
59.8 (15.4) |
92.5 (33.6) |
| Mean daily maximum °F (°C) | 43.2 (6.2) |
45.4 (7.4) |
52.4 (11.3) |
59.3 (15.2) |
66.8 (19.3) |
76.7 (24.8) |
84.9 (29.4) |
83.6 (28.7) |
77.6 (25.3) |
66.5 (19.2) |
54.7 (12.6) |
44.6 (7.0) |
63.0 (17.2) |
| Daily mean °F (°C) | 26.7 (−2.9) |
29.2 (−1.6) |
36.3 (2.4) |
42.0 (5.6) |
49.2 (9.6) |
57.7 (14.3) |
64.2 (17.9) |
62.3 (16.8) |
55.7 (13.2) |
45.3 (7.4) |
35.8 (2.1) |
28.0 (−2.2) |
44.4 (6.9) |
| Mean daily minimum °F (°C) | 10.3 (−12.1) |
13.0 (−10.6) |
20.2 (−6.6) |
24.7 (−4.1) |
31.7 (−0.2) |
38.6 (3.7) |
43.4 (6.3) |
40.9 (4.9) |
33.7 (0.9) |
24.1 (−4.4) |
17.0 (−8.3) |
11.5 (−11.4) |
25.8 (−3.5) |
| Mean minimum °F (°C) | −10.7 (−23.7) |
−6.1 (−21.2) |
1.5 (−16.9) |
11.6 (−11.3) |
18.4 (−7.6) |
26.8 (−2.9) |
33.9 (1.1) |
31.7 (−0.2) |
23.3 (−4.8) |
12.3 (−10.9) |
1.3 (−17.1) |
−7.3 (−21.8) |
−16.7 (−27.1) |
| Record low °F (°C) | −37 (−38) |
−29 (−34) |
−26 (−32) |
−2 (−19) |
6 (−14) |
10 (−12) |
21 (−6) |
19 (−7) |
7 (−14) |
−5 (−21) |
−20 (−29) |
−31 (−35) |
−37 (−38) |
| Average precipitation inches (mm) | 2.01 (51) |
1.48 (38) |
0.87 (22) |
0.62 (16) |
0.68 (17) |
0.44 (11) |
0.48 (12) |
0.39 (9.9) |
0.23 (5.8) |
0.70 (18) |
0.78 (20) |
1.51 (38) |
10.19 (258.7) |
| Average snowfall inches (cm) | 7.4 (19) |
8.2 (21) |
3.9 (9.9) |
2.4 (6.1) |
0.8 (2.0) |
0.1 (0.25) |
0.0 (0.0) |
0.0 (0.0) |
0.0 (0.0) |
0.3 (0.76) |
1.5 (3.8) |
7.3 (19) |
31.9 (81.81) |
| Average precipitation days (≥ 0.01 in) | 5.1 | 5.4 | 4.5 | 3.2 | 3.6 | 1.8 | 2.8 | 2.5 | 2.0 | 2.2 | 2.6 | 4.7 | 40.4 |
| Average snowy days (≥ 0.1 in) | 3.6 | 3.8 | 2.6 | 1.5 | 0.6 | 0.1 | 0.0 | 0.0 | 0.0 | 0.3 | 1.0 | 3.8 | 17.3 |
| Source 1: NOAA | |||||||||||||
| Source 2: National Weather Service | |||||||||||||
Schools in Bridgeport
Bridgeport is part of the Eastern Sierra Unified School District. The main office for this school district is in Bridgeport. The town has an elementary school and a high school called Eastern Sierra Academy. There is also a public library in Bridgeport.
See also
 In Spanish: Bridgeport (California) para niños
 | Dorothy Vaughan |
 | Charles Henry Turner |
 | Hildrus Poindexter |
 | Henry Cecil McBay |


