
California's 8th congressional district facts for kids
Quick facts for kids California's 8th congressional district |
|||
|---|---|---|---|
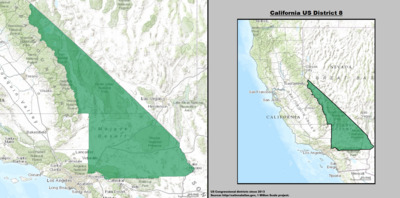
California's 8th congressional district - since January 3, 2013.
|
|||
| Representative |
|
||
| Population (2019) | 723,311 | ||
| Median income | $56,140 | ||
| Ethnicity |
|
||
| Cook PVI | R+9 | ||
California's 8th congressional district is a special area in the U.S. state of California. It's like a puzzle piece that helps decide who represents the people in the United States House of Representatives.
Right now, a Republican named Jay Obernolte is the person representing this district. The 8th district covers most of the eastern desert parts of California. It stretches from Mono Lake all the way to Twentynine Palms. It includes Inyo and Mono counties, plus most of San Bernardino County. This makes it the largest, but also the least crowded, congressional district in California. The biggest city in this district is Victorville.
Before 2011, the 8th district was in San Francisco. But then, a group called the California Citizens Redistricting Commission redrew the lines. The new district boundaries started being used for elections in June 2012.
Contents
Who Wins Elections Here?
Before the district lines were changed in 2011, the 8th district was a strong area for the Democratic Party. For example, in the 2004 election, John Kerry (a Democrat) got a huge 84.2% of the votes here. In 2008, Barack Obama (also a Democrat) got even more, with 85.22% of the votes.
However, the new 8th district, created in 2011, is very different. It's in a part of California where people tend to vote for the Republican Party. Experts even call it "Strongly Republican."
In the 2012 election, which was the first election with the new district lines, something interesting happened. California uses a "top-two primary" system. This means that the two candidates who get the most votes in the first election go on to a final election, no matter what party they are from. In 2012, the 8th district was one of only two districts in California where two Republicans ended up running against each other in the final election! This happened again in 2018, and it was the only district in California where two Republicans faced off.
How People Voted in Important Statewide Elections
Here's a quick look at how the 8th district voted in some big elections across California over the years. This shows how the district's voting habits changed after the new lines were drawn.
| Year | Office | Winner | Tally |
|---|---|---|---|
| 1992 | President | Clinton | 75.6 – 15.9% |
| Senator | Boxer | 79.1 – 16.3% | |
| Senator | Feinstein | 82.4 – 14.0% | |
| 1994 | Governor | Brown | 72.1 – 24.8% |
| Senator | Feinstein | 80.7 – 13.7% | |
| 1996 | President | Clinton | 66.0 – 18.0% |
| 1998 | Governor | Davis | 81.8 – 13.2% |
| Senator | Boxer | 78.0 – 19.2% | |
| 2000 | President | Gore | 76.7 – 14.6% |
| Senator | Feinstein | 72.6 – 14.1% | |
| 2002 | Governor | Davis | 66.7 – 13.9% |
| 2003 | Recall | No | 81.4 – 18.6% |
| Bustamante | 64.7 – 17.8% | ||
| 2004 | President | Kerry | 84.2 – 14.0% |
| Senator | Boxer | 83.7 – 11.7% | |
| 2006 | Governor | Angelides | 64.3 – 27.9% |
| Senator | Feinstein | 80.4 – 7.7% | |
| 2008 | President | Obama | 85.2 – 12.4% |
| 2010 | Governor | Brown | 80.0 – 16.4% |
| Senator | Boxer | 81.3 – 14.7% | |
| 2012 | President | Romney | 55.6 – 41.7% |
| 2014 | Governor | Kashkari | 62.3 – 37.7% |
| 2016 | President | Trump | 54.7 – 39.6% |
| Senator | Harris | 55.1 – 44.9% | |
| 2018 | Governor | Cox | 59.8 – 40.2% |
| Senator | de Leon | 54.3 – 45.7% | |
| 2020 | President | Trump | 54 – 43.6% |
People Who Have Represented This District
A "representative" is a person elected by the people of a district to speak for them in the U.S. House of Representatives in Washington, D.C. They help make laws for the whole country.
Here are some of the people who have represented California's 8th congressional district over the years:
| Member | Party | Dates | What They Did | Counties | |
|---|---|---|---|---|---|
| This district was first created on March 4, 1903. | |||||
|
Nancy Pelosi |
Democratic | January 3, 1993 – January 3, 2013 |
Nancy Pelosi was a very important leader in the House of Representatives. She was even the Speaker of the House! She represented the 8th district when it was in San Francisco. | 1993–2003 Most of San Francisco
|
|
|
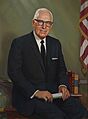
Paul Cook |
Republican | January 3, 2013 – December 7, 2020 |
Paul Cook was the first person to represent the new 8th district after the boundaries changed in 2011. He was re-elected several times. | 2013–present Inyo, Mono, most of San Bernardino 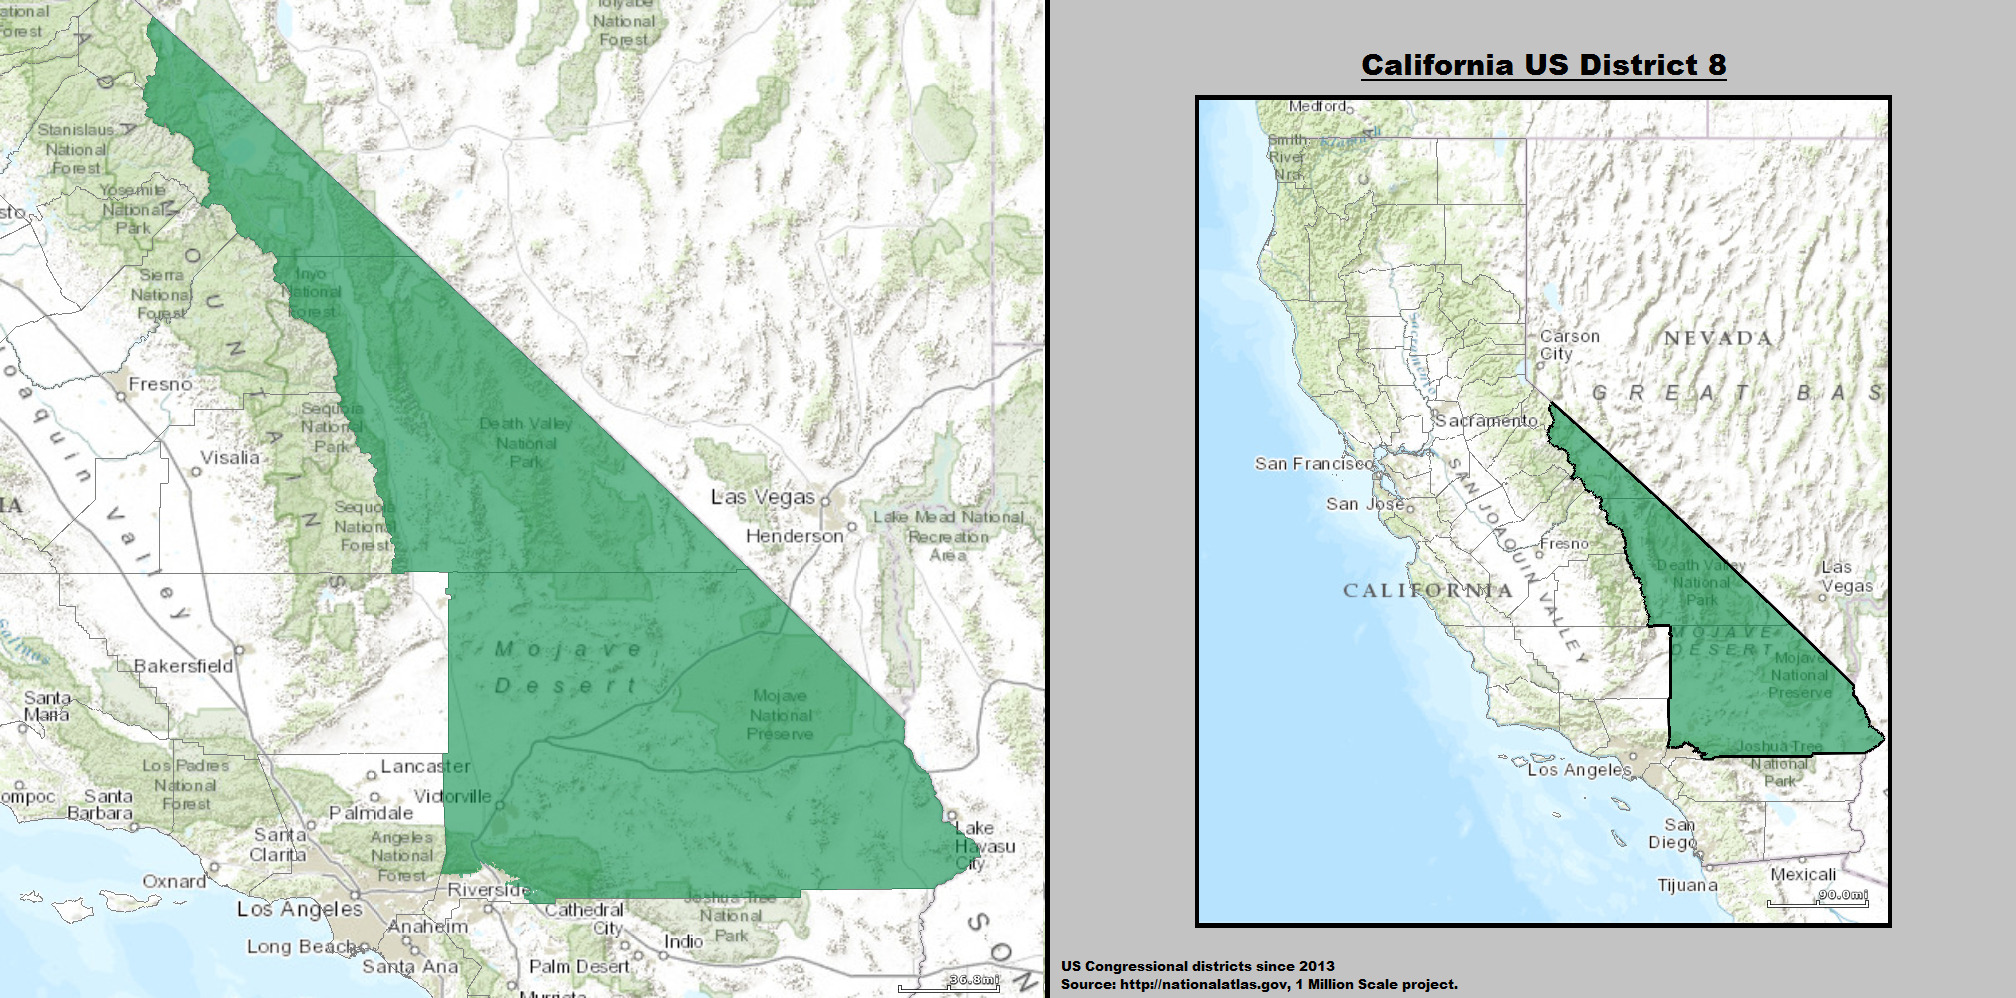 |
|
| Vacant | December 7, 2020 – January 3, 2021 |
The seat was empty for a short time after Paul Cook left. | |||
|
Jay Obernolte |
Republican | January 3, 2021 – Present |
Jay Obernolte was elected in 2020 and is the current representative for the 8th district. | ||


Images for kids
-

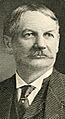
Milton J. Daniels, an early representative of the 8th district.
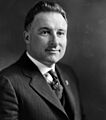
-
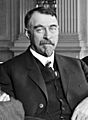
Sylvester C. Smith, who served for many years.
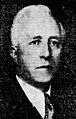
-
Everis A. Hayes, a Republican representative.
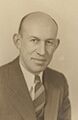
-
Hugh S. Hersman, a Democratic representative.
-
Arthur M. Free, who served for 12 years.
-
John J. McGrath, a Democratic representative.
-
Jack Z. Anderson, a Republican representative.
-
George P. Miller, who represented the district for 20 years.
-
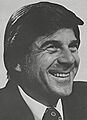
Pete Stark, who later moved to another district.
-
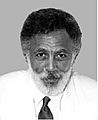
Ron Dellums, a long-serving Democratic representative.
.jpg)


.jpg)


See also
 In Spanish: 8.º distrito congresional de California para niños
