2018 California gubernatorial election facts for kids
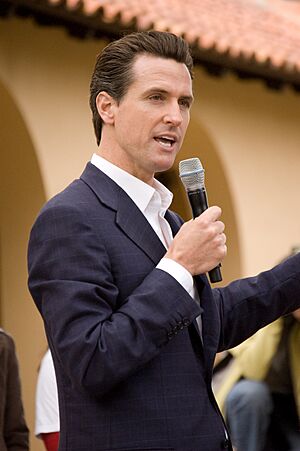
The 2018 California gubernatorial election was an important election held on November 6, 2018. People in California voted to choose their next Governor of California. The governor is like the state's chief leader. The person who was governor before, Jerry Brown, could not run again. This was because of rules called term limits, which say how many times someone can be elected to the same job.
Gavin Newsom won the election easily. His victory was the biggest win in a California governor's election since 1950.
Contents
Choosing Candidates: The Primary Election
Before the main election, there was a primary election on June 5, 2018. In California, the top two candidates from this primary election, no matter their political party, move on to the final election.
| Primary election results | ||||
|---|---|---|---|---|
| Party | Candidate | Votes | % | |
| Democratic | Gavin Newsom | 2,266,406 | 33.57% | |
| Republican | John H. Cox | 1,722,899 | 25.52% | |
| Democratic | Antonio Villaraigosa | 896,556 | 13.28% | |
| Republican | Travis Allen | 640,594 | 9.49% | |
| Democratic | John Chiang | 640,128 | 9.48% | |
| Democratic | Delaine Eastin | 225,165 | 3.34% | |
| Democratic | Amanda Renteria | 89,960 | 1.33% | |
| Republican | Robert C. Newman II | 43,261 | 0.64% | |
| Democratic | Michael Shellenberger | 30,156 | 0.45% | |
| Republican | Peter Y. Liu | 26,243 | 0.39% | |
| Republican | Yvonne Girard | 21,081 | 0.31% | |
| Other candidates | 147,859 | 2.19% | ||
| Total votes | 6,750,308 | 100% | ||
Primary Results by County
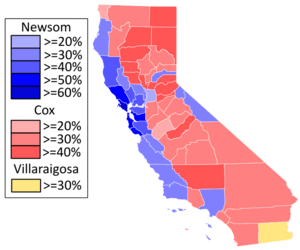
The map shows which candidate won the most votes in each county during the primary election.
- Red areas show counties won by John Cox.
- Blue areas show counties won by Gavin Newsom.
- Yellow areas show counties won by Antonio Villaraigosa.
| County | Newsom % | Cox % | Villaraigosa % | Allen % | Chiang % | Others % |
|---|---|---|---|---|---|---|
| Alameda | 53.5% | 10.6% | 10.0% | 4.4% | 9.6% | 11.9% |
| Alpine | 38.5% | 24.1% | 6.7% | 8.7% | 10.4% | 11.6% |
| Amador | 21.5% | 41.8% | 5.8% | 15.1% | 8.0% | 7.8% |
| Butte | 25.6% | 34.4% | 5.5% | 14.5% | 6.1% | 13.9% |
| Calaveras | 23.3% | 38.2% | 5.3% | 18.1% | 6.6% | 8.5% |
| Colusa | 13.0% | 43.3% | 16.0% | 16.3% | 3.6% | 7.8% |
| Contra Costa | 49.9% | 19.7% | 8.7% | 7.4% | 6.9% | 7.4% |
| Del Norte | 23.4% | 27.0% | 3.5% | 24.8% | 7.7% | 13.6% |
| El Dorado | 24.5% | 40.7% | 5.8% | 13.9% | 8.1% | 7.0% |
| Fresno | 16.8% | 33.7% | 20.2% | 14.3% | 7.6% | 7.4% |
| Glenn | 12.4% | 48.1% | 7.9% | 18.2% | 3.3% | 10.1% |
| Humboldt | 37.9% | 22.3% | 5.0% | 9.6% | 6.4% | 18.8% |
| Imperial | 11.8% | 22.7% | 31.2% | 9.8% | 7.9% | 16.6% |
| Inyo | 22.6% | 30.7% | 8.6% | 15.9% | 8.7% | 13.5% |
| Kern | 12.1% | 40.6% | 13.9% | 19.9% | 5.4% | 8.1% |
| Kings | 9.4% | 36.7% | 17.0% | 23.8% | 6.7% | 6.4% |
| Lake | 37.5% | 28.4% | 6.6% | 12.0% | 5.0% | 10.5% |
| Lassen | 13.1% | 41.7% | 2.1% | 26.8% | 6.6% | 9.7% |
| Los Angeles | 32.7% | 19.6% | 21.7% | 5.8% | 13.2% | 7.0% |
| Madera | 12.8% | 40.2% | 15.7% | 18.9% | 5.2% | 7.2% |
| Marin | 64.1% | 12.5% | 8.2% | 3.8% | 5.3% | 6.1% |
| Mariposa | 19.1% | 34.9% | 8.2% | 23.4% | 6.3% | 8.1% |
| Mendocino | 45.2% | 17.9% | 7.8% | 9.1% | 5.1% | 14.9% |
| Merced | 18.3% | 30.0% | 17.6% | 16.0% | 7.3% | 10.8% |
| Modoc | 11.5% | 51.2% | 2.8% | 17.3% | 3.1% | 14.1% |
| Mono | 31.6% | 26.1% | 12.2% | 12.0% | 5.0% | 13.1% |
| Monterey | 37.8% | 19.8% | 16.8% | 9.4% | 6.6% | 9.6% |
| Napa | 46.1% | 19.4% | 10.0% | 9.7% | 5.5% | 9.3% |
| Nevada | 34.1% | 25.7% | 5.9% | 17.4% | 7.0% | 9.9% |
| Orange | 24.3% | 36.3% | 11.4% | 11.5% | 9.0% | 7.5% |
| Placer | 25.7% | 40.2% | 5.8% | 13.1% | 9.0% | 6.2% |
| Plumas | 26.9% | 38.5% | 3.8% | 15.5% | 5.7% | 9.6% |
| Riverside | 22.3% | 34.4% | 13.7% | 15.3% | 7.5% | 6.8% |
| Sacramento | 29.7% | 26.2% | 10.7% | 10.2% | 14.5% | 8.7% |
| San Benito | 33.6% | 23.4% | 13.3% | 16.0% | 4.8% | 8.9% |
| San Bernardino | 19.7% | 33.9% | 15.2% | 14.7% | 9.2% | 7.3% |
| San Diego | 30.5% | 32.6% | 10.4% | 7.5% | 9.8% | 9.2% |
| San Francisco | 57.5% | 6.6% | 9.1% | 2.2% | 8.9% | 15.7% |
| San Joaquin | 26.3% | 31.4% | 11.1% | 13.6% | 9.3% | 8.3% |
| San Luis Obispo | 33.2% | 29.4% | 6.8% | 14.6% | 7.3% | 8.7% |
| San Mateo | 55.0% | 13.9% | 10.4% | 5.1% | 7.1% | 8.5% |
| Santa Barbara | 33.8% | 26.2% | 12.3% | 11.5% | 6.8% | 9.4% |
| Santa Clara | 48.5% | 13.9% | 10.9% | 8.3% | 7.7% | 10.7% |
| Santa Cruz | 52.4% | 11.8% | 11.5% | 7.0% | 4.5% | 12.8% |
| Shasta | 16.9% | 44.3% | 3.9% | 19.9% | 4.5% | 10.5% |
| Sierra | 22.9% | 35.1% | 3.7% | 17.6% | 7.1% | 13.6% |
| Siskiyou | 23.3% | 34.5% | 3.4% | 18.5% | 5.0% | 15.3% |
| Solano | 41.6% | 23.3% | 8.9% | 11.3% | 6.9% | 8.0% |
| Sonoma | 54.6% | 16.4% | 8.9% | 5.5% | 4.9% | 9.7% |
| Stanislaus | 23.2% | 31.6% | 12.3% | 16.3% | 7.3% | 9.3% |
| Sutter | 16.4% | 40.0% | 8.3% | 17.4% | 8.2% | 9.7% |
| Tehama | 13.2% | 45.4% | 4.5% | 21.6% | 4.7% | 10.6% |
| Trinity | 23.6% | 31.4% | 4.7% | 17.9% | 5.4% | 17.0% |
| Tulare | 13.9% | 36.5% | 16.4% | 20.4% | 5.2% | 7.6% |
| Tuolumne | 26.8% | 37.6% | 5.7% | 15.8% | 5.6% | 8.5% |
| Ventura | 26.7% | 32.6% | 13.4% | 9.1% | 11.0% | 7.2% |
| Yolo | 31.6% | 19.9% | 13.7% | 7.0% | 14.6% | 13.2% |
| Yuba | 16.3% | 39.6% | 7.6% | 21.1% | 6.6% | 8.8% |
| Totals | 33.6% | 25.5% | 13.3% | 9.5% | 9.5% | 8.6% |
The Final Election
The general election took place on November 6, 2018. This was the final vote between the two candidates who won the primary election.
| General election results | ||||
|---|---|---|---|---|
| Party | Candidate | Votes | % | |
| Democratic | Gavin Newsom | 7,721,410 | 61.9% | |
| Republican | John H. Cox | 4,742,825 | 38.1% | |
| Total votes | 12,464,235 | 100.0% | ||
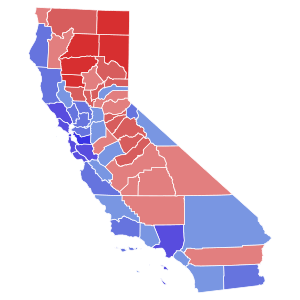
Final Results by County
Here are the final results of the election, showing how each county voted.
| Gavin Newsom
Democratic |
John Cox
Republican |
Total Votes | |||
|---|---|---|---|---|---|
| County | # | % | # | % | # |
| Alameda | 462,558 | 80.6% | 111,677 | 19.4% | 574,235 |
| Alpine | 386 | 62.8% | 229 | 37.2% | 615 |
| Amador | 6,237 | 35.5% | 11,356 | 64.5% | 17,593 |
| Butte | 41,500 | 46.8% | 47,226 | 53.2% | 88,726 |
| Calaveras | 7,765 | 35.9% | 13,845 | 64.1% | 21,610 |
| Colusa | 1,999 | 34.7% | 3,764 | 65.3% | 5,763 |
| Contra Costa | 283,805 | 68.2% | 132,345 | 31.8% | 416,150 |
| Del Norte | 3,441 | 41.3% | 4,887 | 58.7% | 8,328 |
| El Dorado | 36,297 | 40.6% | 53,140 | 59.4% | 89,437 |
| Fresno | 124,332 | 49.1% | 128,974 | 50.9% | 253,306 |
| Glenn | 2,424 | 29.1% | 5,908 | 70.9% | 8,332 |
| Humboldt | 33,455 | 64.5% | 18,418 | 35.5% | 51,873 |
| Imperial | 20,573 | 61.7% | 12,785 | 38.3% | 33,358 |
| Inyo | 3,244 | 44.7% | 4,018 | 55.3% | 7,262 |
| Kern | 83,507 | 41.1% | 119,870 | 58.9% | 203,377 |
| Kings | 12,275 | 40.6% | 17,976 | 59.4% | 30,251 |
| Lake | 10,869 | 51.4% | 10,280 | 48.6% | 21,149 |
| Lassen | 2,043 | 22.7% | 6,973 | 77.3% | 9,016 |
| Los Angeles | 2,114,699 | 71.9% | 826,402 | 28.1% | 2,941,101 |
| Madera | 15,037 | 39.0% | 23,488 | 61.0% | 38,525 |
| Marin | 103,671 | 79.5% | 26,750 | 20.5% | 130,421 |
| Mariposa | 3,183 | 38.7% | 5,043 | 61.3% | 8,226 |
| Mendocino | 22,152 | 66.3% | 11,255 | 33.7% | 33,407 |
| Merced | 30,783 | 52.0% | 28,424 | 48.0% | 59,207 |
| Modoc | 820 | 23.8% | 2,628 | 76.2% | 3,448 |
| Mono | 2,706 | 55.8% | 2,147 | 44.2% | 4,853 |
| Monterey | 76,648 | 66.0% | 39,516 | 34.0% | 116,164 |
| Napa | 36,513 | 64.8% | 19,834 | 35.2% | 56,347 |
| Nevada | 27,985 | 52.9% | 24,882 | 47.1% | 52,867 |
| Orange | 543,047 | 50.1% | 539,951 | 49.9% | 1,082,998 |
| Placer | 72,270 | 41.2% | 103,157 | 58.8% | 175,427 |
| Plumas | 3,433 | 37.2% | 5,807 | 62.8% | 9,240 |
| Riverside | 319,845 | 49.8% | 322,243 | 50.2% | 642,088 |
| Sacramento | 302,696 | 58.8% | 212,010 | 41.2% | 514,706 |
| San Benito | 11,274 | 56.1% | 8,815 | 43.9% | 20,089 |
| San Bernardino | 276,874 | 51.5% | 260,379 | 48.5% | 537,253 |
| San Diego | 658,346 | 56.9% | 499,532 | 43.1% | 1,157,878 |
| San Francisco | 312,181 | 86.4% | 49,181 | 13.6% | 361,362 |
| San Joaquin | 101,474 | 52.2% | 92,966 | 47.8% | 194,440 |
| San Luis Obispo | 65,117 | 51.6% | 61,137 | 48.4% | 126,254 |
| San Mateo | 213,282 | 75.2% | 70,242 | 24.8% | 283,524 |
| Santa Barbara | 93,841 | 60.5% | 61,300 | 39.5% | 155,141 |
| Santa Clara | 438,758 | 71.4% | 175,791 | 28.6% | 614,549 |
| Santa Cruz | 91,523 | 76.8% | 27,665 | 23.2% | 119,188 |
| Shasta | 20,256 | 28.9% | 49,825 | 71.1% | 70,081 |
| Sierra | 599 | 35.9% | 1,068 | 64.1% | 1,667 |
| Siskiyou | 7,218 | 39.7% | 10,946 | 60.3% | 18,164 |
| Solano | 89,694 | 61.3% | 56,627 | 38.7% | 146,321 |
| Sonoma | 152,040 | 72.3% | 58,338 | 27.7% | 210,378 |
| Stanislaus | 77,220 | 49.2% | 79,751 | 50.8% | 156,971 |
| Sutter | 11,122 | 37.0% | 18,935 | 63.0% | 30,057 |
| Tehama | 5,756 | 27.5% | 15,137 | 72.5% | 20,893 |
| Trinity | 2,250 | 42.3% | 3,075 | 57.7% | 5,325 |
| Tulare | 42,702 | 42.8% | 57,012 | 57.2% | 99,714 |
| Tuolumne | 9,294 | 38.9% | 14,580 | 61.1% | 23,874 |
| Ventura | 171,729 | 55.6% | 137,393 | 44.4% | 309,122 |
| Yolo | 49,759 | 67.8% | 23,611 | 32.2% | 73,370 |
| Yuba | 6,903 | 36.0% | 12,293 | 64.0% | 19,196 |
| Totals | 7,721,410 | 61.9% | 4,742,825 | 38.1% | 12,464,235 |
See also
 In Spanish: Elecciones para gobernador de California de 2018 para niños
 | Lonnie Johnson |
 | Granville Woods |
 | Lewis Howard Latimer |
 | James West |


