
Yuba County, California facts for kids
Quick facts for kids
County of Yuba
|
||
|---|---|---|
.jpg) .jpg)  Images, from top down, left to right: Englebright Lake, Englebright Dam and Beale Air Force Base
|
||
|
||

Location in the state of California
|
||
| Country | United States | |
| State | California | |
| County | Yuba County | |
| CSA | Sacramento–Arden-Arcade–Yuba City | |
| Incorporated | February 18, 1850 | |
| Named for | Yuba River | |
| County seat | Marysville | |
| Largest community | Linda (population) Loma Rica (area) Marysville (incorporated) |
|
| Government | ||
| • Type | Council–Administrator | |
| Area | ||
| • Total | 644 sq mi (1,670 km2) | |
| • Land | 632 sq mi (1,640 km2) | |
| • Water | 12 sq mi (30 km2) | |
| Highest elevation | 4,828 ft (1,472 m) | |
| Population
(2020)
|
||
| • Total | 81,575 | |
| • Density | 126.67/sq mi (48.91/km2) | |
| GDP | ||
| • Total | $3.768 billion (2022) | |
| Time zone | UTC-8 (Pacific Time Zone) | |
| • Summer (DST) | UTC-7 (Pacific Daylight Time) | |
| Congressional districts | 1st, 3rd | |

Yuba County is a county in north-central California, United States. In 2020, about 81,575 people lived there. Yuba County is part of the larger Sacramento metropolitan area. The county is located in the Central Valley region. It sits along the Feather River. The main town and county seat is Marysville.
Contents
History of Yuba County
Yuba County was one of the first counties in California. It was created in 1850 when California became a state. Some parts of Yuba County were later given to other counties. These included Placer County in 1851, Nevada County in 1851, and Sierra County in 1852.
The county got its name from the Yuba River. Captain John Sutter named the river after a Maidu village called Yubu or Yupu. This village was located near where the Yuba and Feather Rivers meet. Another story says the river was named Uba by explorers in 1824. They found many wild grapes (uvas silvestres in Spanish) growing along its banks.
Geography and Nature
Yuba County covers about 644 square miles. Only a small part, about 12 square miles, is covered by water. It is California's fifth-smallest county by land area. The county is on the western side of the Sierra Nevada mountains. The steep slopes here are great for building hydroelectric power plants. These plants use water to make electricity.
Most people live in the western part of the county, on the flat valley floor. This is where Marysville, the county seat, is located. A lot of farming happens here. Farmers grow fruits, rice, and raise cattle.
Amazing Plant Life
Yuba County is a very special place for plants. It has the most different kinds of plants in the entire United States. Scientists have found 1,968 native vascular plant species here. In total, 2,772 different plant species have been seen. One beautiful flowering plant found here is the yellow mariposa lily (Calochortus luteus).
Some parts of Yuba County are protected natural areas. These include parts of the Plumas National Forest and the Tahoe National Forest. The county also has many natural areas like forests, grasslands, and meadows.
Neighboring Counties
- Butte County to the north
- Sierra County to the northeast
- Nevada County to the east
- Placer County to the southeast
- Sutter County to the southwest
Getting Around Yuba County
Main Roads
 State Route 20
 State Route 49
 State Route 65
 State Route 70
Public Transport
Yuba Sutter Transit offers local bus services. They also have buses that go to downtown Sacramento. Greyhound buses also stop in Marysville.
Airports
Yuba County Airport is about 3 miles (5 km) south of Marysville. It is used for general aviation, like small planes.
Brownsville Aero Pines Airport is another airport. It is located off La Porte Road in Brownsville.
People and Population
| Historical population | |||
|---|---|---|---|
| Census | Pop. | %± | |
| 1850 | 9,673 | — | |
| 1860 | 13,668 | 41.3% | |
| 1870 | 10,851 | −20.6% | |
| 1880 | 11,284 | 4.0% | |
| 1890 | 9,636 | −14.6% | |
| 1900 | 8,620 | −10.5% | |
| 1910 | 10,042 | 16.5% | |
| 1920 | 10,375 | 3.3% | |
| 1930 | 11,331 | 9.2% | |
| 1940 | 17,034 | 50.3% | |
| 1950 | 24,420 | 43.4% | |
| 1960 | 33,859 | 38.7% | |
| 1970 | 44,736 | 32.1% | |
| 1980 | 49,733 | 11.2% | |
| 1990 | 58,228 | 17.1% | |
| 2000 | 60,219 | 3.4% | |
| 2010 | 72,155 | 19.8% | |
| 2020 | 81,575 | 13.1% | |
| 2023 (est.) | 85,722 | 18.8% | |
| U.S. Decennial Census 1790–1960 1900–1990 1990–2000 2010 2020 |
|||
In 2020, Yuba County had a population of 81,575 people. Most people were White, making up about 51% of the population. About 29% of the people were Hispanic or Latino. Other groups included Asian, Black or African American, and Native American people.
In 2000, the average household had about 2.87 people. The average family had about 3.34 people. About 38% of households had children living with them. The median age in the county was 31 years old.
Education in Yuba County
For higher education, students can attend Yuba Community College. The county also has a Yuba County Library system. There is one library branch in Marysville.
Towns and Cities
Cities
- Marysville (This is the main town, also called the county seat)
- Wheatland
Census-designated places
- Beale Air Force Base
- Camptonville
- Challenge-Brownsville
- Dobbins
- Linda
- Loma Rica
- Olivehurst
- Plumas Lake
- Smartsville
Other Communities
Old Ghost Towns
Largest Communities by Population
This table shows the population of Yuba County's communities based on the 2010 census.
| Rank | City/Town/etc. | Type | Population (2010 Census) |
|---|---|---|---|
| 1 | Linda | CDP | 17,773 |
| 2 | Olivehurst | CDP | 13,656 |
| 3 | Marysville (county seat) | City | 12,072 |
| 4 | Plumas Lake | CDP | 5,853 |
| 5 | Wheatland | City | 3,456 |
| 6 | Loma Rica | CDP | 2,368 |
| 7 | Beale Air Force Base | CDP | 1,319 |
| 8 | Challenge-Brownsville | CDP | 1,148 |
| 9 | Dobbins | CDP | 624 |
| 10 | Smartsville | CDP | 177 |
| 11 | Camptonville | CDP | 158 |
Images for kids
-
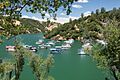
Englebright Lake
-
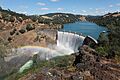
Englebright Dam
-
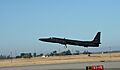
Beale Air Force Base
See also
 In Spanish: Condado de Yuba para niños
