
Monterey County, California facts for kids
Quick facts for kids
Monterey County, California
|
|||
|---|---|---|---|
| County of Monterey | |||
     Pictures from Monterey County: Monterey Bay Aquarium, Main Street in Salinas, the seventh hole at Pebble Beach Golf Links, Mission Soledad, and the Big Sur Coastline.
|
|||
|
|||

Location in the state of California
|
|||
| Country | United States | ||
| State | California | ||
| Incorporated | February 18, 1850 | ||
| Named for | Monterey Bay | ||
| County seat | Salinas | ||
| Largest city | Salinas | ||
| Government | |||
| • Type | Council–CAO | ||
| • Body | Board of Supervisors | ||
| Area | |||
| • Total | 3,771 sq mi (9,770 km2) | ||
| • Land | 3,281 sq mi (8,500 km2) | ||
| • Water | 491 sq mi (1,270 km2) | ||
| Highest elevation | 5,865 ft (1,788 m) | ||
| Population
(2020)
|
|||
| • Total | 439,035 | ||
| • Estimate
(2023)
|
430,723 |
||
| • Density | 116.424/sq mi (44.952/km2) | ||
| GDP | |||
| • Total | $33.249 billion (2022) | ||
| Time zone | UTC-8 (Pacific Time Zone) | ||
| • Summer (DST) | UTC-7 (Pacific Daylight Time) | ||
| Area codes | 805, 831 | ||
| Congressional districts | 18th, 19th | ||


Monterey County is a county located on the Pacific coast in the state of California. In 2020, about 439,035 people lived here. The biggest city and county seat is Salinas. Monterey County is famous worldwide for its beautiful coastline, including places like Carmel-by-the-Sea, Big Sur, and the 17 Mile Drive.
Long ago, when California was under Spanish and Mexican rule, the city of Monterey was its capital. Today, the county's economy mostly relies on tourism along the coast and farming in the Salinas River valley. Most people live near the northern coast or in the Salinas Valley. The southern coast and mountains are not as crowded.
Contents
History of Monterey County
.jpg)
Monterey County was one of the first counties in California. It was created in 1850 when California became a state. Later, in 1874, some parts of the county were given to San Benito County. Before European settlers arrived, the area was home to the Ohlone, Salinan, and Esselen Native American tribes.
The county gets its name from Monterey Bay. The bay was named in 1602 by Sebastián Vizcaíno. He named it after the Count of Monterrey, who was the ruler of New Spain at the time. The name Monterrey comes from Monterrei, a town in Spain where the Count and his father were from.
Geography of Monterey County
Monterey County covers about 3,771 square miles. About 3,281 square miles are land, and 491 square miles (13%) are water. This means the county is roughly 1.5 times bigger than the state of Delaware. It has a similar population and size to Santa Barbara County.
Neighboring Counties

Monterey County is surrounded by other counties:
- Santa Cruz County to the north.
- San Benito County, Fresno County, and Kings County to the east.
- San Luis Obispo County to the south.
Protected Natural Areas
Several important natural areas are partly or fully located in Monterey County:
- Los Padres National Forest
- Pinnacles National Park
- Salinas River National Wildlife Refuge
- Ventana Wilderness
Protected Ocean Areas
Monterey County also has special areas in the ocean to protect marine life:
- Soquel Canyon State Marine Conservation Area
- Elkhorn Slough State Marine Reserve
- Elkhorn Slough State Marine Conservation Area
- Moro Cojo Slough State Marine Reserve
- Portuguese Ledge State Marine Conservation Area
- Pacific Grove Marine Gardens State Marine Conservation Area
- Lovers Point State Marine Reserve
- Edward F. Ricketts State Marine Conservation Area
- Asilomar State Marine Reserve
Plants and Animals
Monterey County is home to several endangered species (plants and animals that are at risk of disappearing):
- Hickman's potentilla (a type of plant)
- Santa Cruz Long-toed Salamander
- Santa Cruz Tarweed (another plant)
- Southern Steelhead Trout (a type of fish)
- Yadon's piperia (a type of orchid)
People of Monterey County
| Historical population | |||
|---|---|---|---|
| Census | Pop. | %± | |
| 1850 | 1,872 | — | |
| 1860 | 4,739 | 153.2% | |
| 1870 | 9,876 | 108.4% | |
| 1880 | 11,302 | 14.4% | |
| 1890 | 18,637 | 64.9% | |
| 1900 | 19,380 | 4.0% | |
| 1910 | 24,146 | 24.6% | |
| 1920 | 27,980 | 15.9% | |
| 1930 | 53,705 | 91.9% | |
| 1940 | 73,032 | 36.0% | |
| 1950 | 130,498 | 78.7% | |
| 1960 | 198,351 | 52.0% | |
| 1970 | 250,071 | 26.1% | |
| 1980 | 290,444 | 16.1% | |
| 1990 | 355,660 | 22.5% | |
| 2000 | 401,762 | 13.0% | |
| 2010 | 415,057 | 3.3% | |
| 2020 | 439,035 | 5.8% | |
| 2023 (est.) | 430,723 | 3.8% | |
| U.S. Decennial Census 1790–1960 1900–1990 1990–2000 2010 2020 |
|||
Population in 2020
In 2020, Monterey County had a population of 439,035 people. The largest group was Hispanic or Latino, making up about 60.43% of the population. People who identified as White made up about 27.35%. Other groups included Asian (5.72%), Black or African American (2.06%), and Mixed Race (3.22%).
Income and Education


Some parts of Monterey County, like the western and southern Monterey Peninsula and parts of Carmel Valley, have higher incomes and more people with college degrees. These areas often have household incomes much higher than the average for California or the U.S.
However, other areas, especially in central and eastern Salinas, and parts of Monterey, Seaside, Marina, Soledad, and King City, have lower incomes and fewer people with higher education. In some of these areas, many people live below the poverty line.
Media in Monterey County
People in Monterey County get their TV and radio from local stations. There are also several local newspapers, including the Monterey County Herald, Monterey County Weekly, Salinas Californian, and the Carmel Pine Cone.
Home Prices
Monterey County has some of the most expensive homes in America. For example, in December 2005, the average home price was about $699,900. This high cost can make it hard for many people to buy a home in the area. However, home prices have changed over time, and they dropped significantly by September 2008.
Transportation in Monterey County
Main Highways
You can travel through Monterey County using these major highways:
 U.S. Route 101
 State Route 1
 State Route 25
 State Route 68
 State Route 146
 State Route 156
 State Route 183
 State Route 198
 State Route 218
Public Transport
You can get around Monterey County using Amtrak trains and Greyhound Lines buses. Monterey-Salinas Transit also provides bus service throughout most of the county. This includes buses to Big Sur, King City, Monterey, Salinas, and Carmel. They even have service to San Jose, California.
Airports
Monterey County has several airports:
- Monterey Regional Airport is near the city of Monterey, California. You can find commercial flights here.
- Marina Municipal Airport is in the city of Marina, California.
- Salinas Municipal Airport is in the southeast part of Salinas, California.
- Mesa Del Rey Airport is in the city of King City, California.
Communities in Monterey County
Cities
Census-Designated Places (CDPs)
Unincorporated Communities
- Ambler Park
- Big Sur Village
- Bryson
- Cachagua
- Carmel Highlands
- Carmel Valley
- Corral de Tierra
- Gorda
- Jamesburg
- Jolon
- Notleys Landing
- Old Hilltown
- Pacific Grove Acres
- Parkfield
- Plaskett
- Posts
- Robles del Rio
- San Benancio
- Santa Lucia Preserve
- Slates Hot Springs
- Springtown
- Sycamore Flat
- Tassajara Hot Springs
- White Rock
Other Important Places
- Big Sur
- Laguna Seca Ranch
- Fort Ord Military Base (now partly California State University, Monterey Bay)
- Naval Postgraduate School
- Fort Hunter Liggett
- Presidio of Monterey, home to the Defense Language Institute
- Jacks Peak Park, the highest point on the Monterey Peninsula
Population Ranking of Communities (2020)
This table shows the population of cities and towns in Monterey County, based on the 2020 census.
† county seat
| Rank | City/Town/etc. | Type | Population (2020 Census) |
|---|---|---|---|
| 1 | † Salinas | City | 163,542 |
| 2 | Seaside | City | 32,366 |
| 3 | Monterey | City | 30,218 |
| 4 | Soledad | City | 24,925 |
| 5 | Marina | City | 22,359 |
| 6 | Greenfield | City | 18,937 |
| 7 | Prunedale | CDP | 18,885 |
| 8 | Pacific Grove | City | 15,090 |
| 9 | King City | City | 13,332 |
| 10 | Gonzales | City | 8,647 |
| 11 | Castroville | CDP | 7,515 |
| 12 | Carmel Valley | CDP | 6,189 |
| 13 | Del Monte Forest | CDP | 4,204 |
| 14 | Carmel-by-the-Sea | City | 3,220 |
| 15 | Las Lomas | CDP | 3,046 |
| 16 | Pajaro | CDP | 2,882 |
| 17 | Aromas (partially in San Benito County) | CDP | 2,708 |
| 18 | Pine Canyon | CDP | 1,871 |
| 19 | Boronda | CDP | 1,760 |
| 20 | Del Rey Oaks | City | 1,592 |
| 21 | Elkhorn | CDP | 1,588 |
| 22 | Chualar | CDP | 1,185 |
| 23 | Spreckels | CDP | 692 |
| 24 | San Ardo | CDP | 392 |
| 25 | Lockwood | CDP | 368 |
| 26 | Sand City | City | 325 |
| 27 | San Lucas | CDP | 324 |
| 28 | Moss Landing | CDP | 237 |
| 29 | Bradley | CDP | 69 |
Education in Monterey County
Monterey County has many school districts that serve students from kindergarten through high school.
Unified School Districts
These districts serve all grades from elementary to high school:
- Aromas-San Juan Unified School District
- Big Sur Unified School District
- Gonzales Unified School District
- Carmel Unified School District
- Coalinga-Huron Unified School District
- Monterey Peninsula Unified School District
- North Monterey County Unified School District
- Pacific Grove Unified School District
- Pajaro Valley Joint Unified School District
- Shandon Joint Unified School District
- Soledad Unified School District
High School Districts
These districts focus on high school education:
- Paso Robles Joint Unified School District (serves grades 9–12 in its part of the county)
- Salinas Union High School District
- South Monterey County Joint Union High School District
Elementary School Districts
These districts focus on elementary school education:
- Alisal Union Elementary School District
- Bradley Union Elementary School District
- Chualar Union Elementary School District
- Graves Elementary School District
- Greenfield Union Elementary School District
- King City Union Elementary School District
- Lagunita Elementary School District
- Mission Union Elementary School District
- Pleasant Valley Joint Union Elementary School District
- Salinas City Elementary School District
- San Antonio Union Elementary School District
- San Ardo Union Elementary School District
- San Lucas Union Elementary School District
- San Miguel Joint Union Elementary School District
- Santa Rita Union Elementary School District
- Spreckels Union Elementary School District
- Washington Union Elementary School District
Images for kids
-
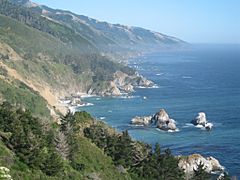
Big Sur - Midcounty coastline with the McWay Rocks in foreground
-
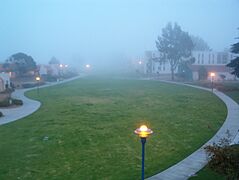
California State University at Monterey Bay
-
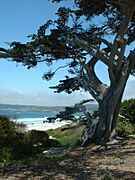
Carmel-by-the-Sea - Beach scene
-
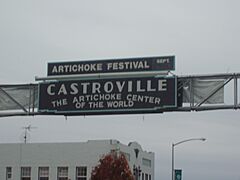
Castroville - Main entrance to the city
-
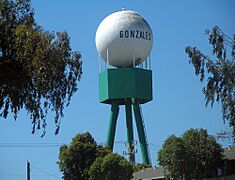
Gonzales - Water tower
-
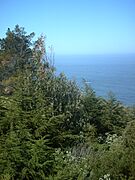
Gorda, California - A view of the Pacific Ocean
-
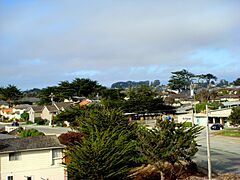
Marina neighborhood
-
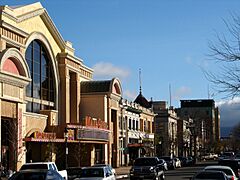
Main Street - Salinas
-
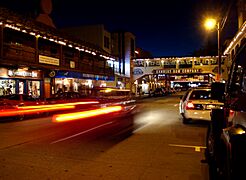
Monterey - Cannery Row
-
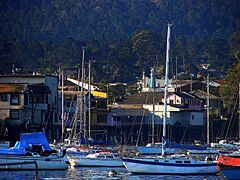
Monterey - Fisherman's Wharf
-
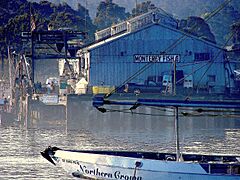
Monterey - Commercial Wharf
-
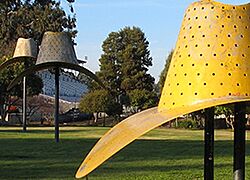
Hat in three stages of landing by Claes Oldemburg - Salinas
-
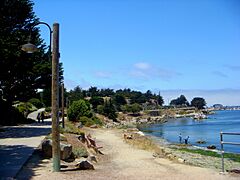
Monterey - Beachside recreational trail
-
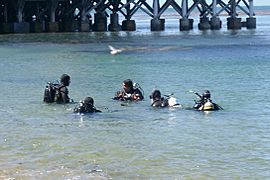
Monterey - Scuba diving lessons in Monterey Bay
-

Monterey - Fremont Peak, viewed from the Monterey Bay Aquarium
-
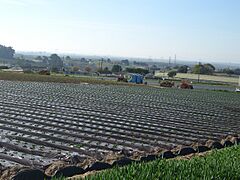
Monterey County - Strawberry fields in rural area
-
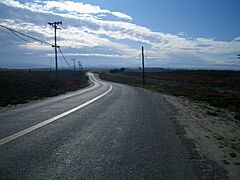
Lapis Road looking south
-
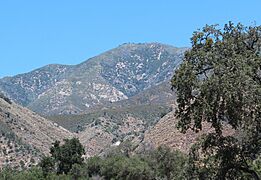
Junipero Serra Peak, highest point in the county
-
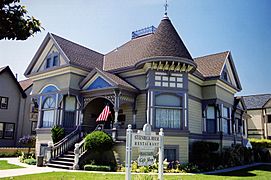
Salinas - John Steinbeck's former home
-
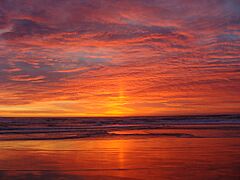
Marina Sunset
-
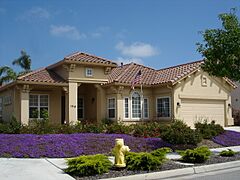
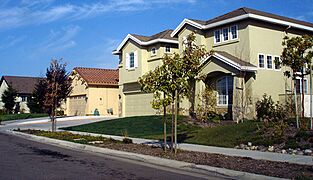
Salinas - Newer Spanish-Revival style house in Harden Ranch
-
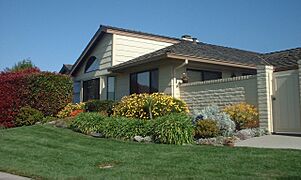
Salinas - An average 1,400 sq ft (130 m2) home in North Salinas
-
Salinas - Residential neighborhood at Harden Ranch, Salinas
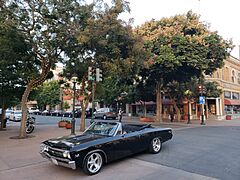
-
Salinas - Downtown
-
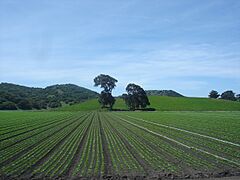
Agricultural fields in the Salinas Valley
-
Steinbeck House - Salinas


See also
 In Spanish: Condado de Monterrey para niños
