
San Benito County, California facts for kids
Quick facts for kids
San Benito County
|
|||
|---|---|---|---|
| County of San Benito | |||
   Images, from top down, left to right: San Benito County Courthouse, Mission San Juan Bautista, New Idria grounds
|
|||
|
|||

Location in the state of California
|
|||
| Country | United States | ||
| State | California | ||
| Region | Central Coast | ||
| CSA | San Jose-San Francisco-Oakland | ||
| Metro | San Jose-Sunnyvale-Santa Clara | ||
| Incorporated | February 12, 1874 | ||
| Named for | San Benito River | ||
| County seat | Hollister | ||
| Largest city | Hollister | ||
| Government | |||
| • Type | Council–CEO | ||
| • Body | Board of Supervisors | ||
| Area | |||
| • Total | 1,390 sq mi (3,600 km2) | ||
| • Land | 1,389 sq mi (3,600 km2) | ||
| • Water | 1.8 sq mi (5 km2) | ||
| Highest elevation | 5,245 ft (1,599 m) | ||
| Population
(2020)
|
|||
| • Total | 64,209 | ||
| • Density | 46.19/sq mi (17.84/km2) | ||
| GDP | |||
| • Total | $2.736 billion (2022) | ||
| Time zone | UTC−8 (Pacific Time Zone) | ||
| • Summer (DST) | UTC−7 (Pacific Daylight Time) | ||
| Area code | 831 | ||
| FIPS code | 06-069 | ||
| GNIS feature ID | 277299 | ||
| Congressional district | 18th | ||


San Benito County is a county in the Central Coast area of California. Its name comes from "San Benito," which is Spanish for "Saint Benedict."
As of the 2020 census, about 64,209 people live here. The main city and county seat is Hollister. San Benito County is part of the larger San Jose-Sunnyvale-Santa Clara area. An old road called El Camino Real goes through the county. It passes by the historic San Juan Bautista mission.
Contents
History of San Benito County
Before Europeans arrived, the Mutsun people, a group of Ohlone Native Americans, lived in the San Benito County area.
Early European Exploration and Naming
In 1772, a priest named Juan Crespí explored the area. He found a small river and named it after San Benito de Nursia, also known as Saint Benedict. Saint Benedict is known as the patron saint of monks. The county and its valley were later named after this river.
First Settlements and Towns
In 1797, Spanish missionaries built the first European settlement. This was the San Juan Bautista mission. In 1848, the United States took control of California, including this area.
The town of New Idria started around 1857. It grew because of the New Idria Mercury Mine. When the mine closed in 1972, New Idria became a ghost town.
Founding of Hollister and County Formation
The city of Hollister was founded on November 19, 1868. It was started by William Welles Hollister on land that used to be a Mexican ranch called Rancho San Justo.
In 1874, the California government created San Benito County. It was formed from a part of Monterey County. Hollister was chosen as the new county seat. Later, in 1887, parts of Merced and Fresno Counties were added to San Benito County. This happened because the New Idria mining community was growing. Other early towns in the county include Tres Pinos and Paicines.
Geography of San Benito County

San Benito County covers about 1,390 square miles (3,600 square kilometers). Most of this area is land. Only a small part, about 1.8 square miles, is water.
Location and Nearby Areas
The county shares a border with Santa Clara County. It is sometimes considered part of the San Francisco Bay Area. San Benito County is also connected to the Monterey Bay Area through groups like the Association of Monterey Bay Area Governments. The Pajaro River flows from northern San Benito County into Monterey Bay.
The county also borders Merced County and Fresno County to the east. These counties reach into California's San Joaquin Valley. To the west, it borders Santa Cruz County. To the southwest, it borders Monterey County.
Wine Regions
San Benito County is home to several wine-growing areas. These include the Mount Harlan and San Benito American Viticultural Areas. The San Benito area includes smaller regions like Cienega Valley, Lime Kiln Valley, and Paicines.
Plant Life in San Benito County
San Benito County has many different types of plants. This is because of its varied landscape, different kinds of rocks, and changing climate. The climate ranges from near the coast to inland areas.
Common plant types include:
- Grasslands with annual plants
- Coastal scrub
- Chaparral
- Oak woodland
Desert and Unique Plants
In the very southeastern part of the county, around Panoche Valley, the climate is dry. This area is part of the San Joaquin Desert. Here, you can find plants like saltbush scrub and California juniper woodland. A special plant called Panoche Hills navarretia grows almost only in this small desert area.
Mountain Forests and Rare Species
At the highest points, like Fremont Peak and San Benito Mountain, there is more rain and cooler temperatures. This allows mixed conifer forests to grow. On San Benito Mountain, the unique serpentine soils support a special forest. This forest includes foothill pine, Coulter pine, Jeffrey pine, and incense cedar.
The tough conditions of the serpentine soils also support many rare plants. These include:
- San Benito evening primrose
- Rayless layia
- Guirado's goldenrod
- San Benito fritillary
Some plant species are even named after San Benito County. For example, Benitoa occidentalis and Camissonia benitensis. The plant Hollisteria lanata is named after William Welles Hollister, who founded the city of Hollister.
Animal Life in San Benito County
San Benito County is home to interesting animals.
Unique Millipede Discovery
In 1926, a special millipede called Illacme plenipes was found here. It has more legs than any other known millipede species.
California Condor Conservation
The California condor is a very rare bird. In 2022, a condor was found harmed in the county. The U.S. Fish and Wildlife Service offered a reward for information about what happened. This shows how important it is to protect these animals.
National Protected Area
- Pinnacles National Park is a beautiful national park located in San Benito County.
Population and People
| Historical population | |||
|---|---|---|---|
| Census | Pop. | %± | |
| 1880 | 5,584 | — | |
| 1890 | 6,412 | 14.8% | |
| 1900 | 6,633 | 3.4% | |
| 1910 | 8,041 | 21.2% | |
| 1920 | 8,995 | 11.9% | |
| 1930 | 11,311 | 25.7% | |
| 1940 | 11,392 | 0.7% | |
| 1950 | 14,370 | 26.1% | |
| 1960 | 15,396 | 7.1% | |
| 1970 | 18,226 | 18.4% | |
| 1980 | 25,005 | 37.2% | |
| 1990 | 36,697 | 46.8% | |
| 2000 | 53,234 | 45.1% | |
| 2010 | 55,269 | 3.8% | |
| 2020 | 64,209 | 16.2% | |
| 2023 (est.) | 68,175 | 23.4% | |
| U.S. Decennial Census 1790–1960 1900–1990 1990–2000 2010 2020 |
|||
Population in 2020
In 2020, San Benito County had a population of 64,209 people. The county is known for having a large Hispanic or Latino population. In 2010, San Benito County was the only county in the greater San Francisco Bay Area where Hispanic people were the majority.
| Race / Ethnicity (NH = Non-Hispanic) | Pop 2000 | Pop 2010 | Pop 2020 | % 2000 | % 2010 | % 2020 |
|---|---|---|---|---|---|---|
| White alone (NH) | 24,513 | 21,154 | 19,785 | 46.05% | 38.27% | 30.81% |
| Black or African American alone (NH) | 475 | 355 | 479 | 0.89% | 0.64% | 0.75% |
| Native American or Alaska Native alone (NH) | 279 | 231 | 221 | 0.52% | 0.42% | 0.34% |
| Asian alone (NH) | 1,173 | 1,298 | 2,189 | 2.20% | 2.35% | 3.41% |
| Pacific Islander alone (NH) | 68 | 65 | 127 | 0.13% | 0.12% | 0.20% |
| Other Race alone (NH) | 53 | 67 | 332 | 0.10% | 0.12% | 0.52% |
| Mixed Race or Multi-Racial (NH) | 1,157 | 913 | 1,835 | 2.17% | 1.65% | 2.86% |
| Hispanic or Latino (any race) | 25,516 | 31,186 | 39,241 | 47.93% | 56.43% | 61.11% |
| Total | 53,234 | 55,269 | 64,209 | 100.00% | 100.00% | 100.00% |
Population in 2010
In 2010, the county had 55,269 people. About 63.7% were White, 0.9% African American, and 1.6% Native American. About 2.6% were Asian, and 0.2% were Pacific Islander. People of other races made up 26.2%, and 4.9% were of two or more races. Overall, 56.4% of the population was Hispanic or Latino.
Economy of San Benito County
The main economic activity in San Benito County is agriculture. This means farming is very important.
Agritourism and Local Products
Agritourism is also growing. This is when people visit farms and rural areas for fun. San Benito County has wineries and organic farms. Visitors can enjoy the countryside and see cattle grazing.
Top Employers in the County
Many businesses provide jobs in San Benito County. Here are some of the largest employers:
| # | Employer | # of Employees |
|---|---|---|
| 1 | Earthbound Farm | 1,000+ |
| 2 | R&R Labor | 500-999 |
| 3 | Hazel Hawkins Memorial Hospital | 250–499 |
| 4 | Mcelectronics Inc. | 250–499 |
| 5 | San Benito High School | 250–499 |
| 6 | True Leaf Farms | 250–499 |
| 7 | Corbin Sparrow | 100–249 |
| 8 | Denise & Filice Packing Co | 100–249 |
| 9 | Nob Hill Foods | 100–249 |
| 10 | San Benito Foods | 100–249 |
| 11 | San Benito County Sheriff | 100–249 |
| 12 | Target | 100–249 |
| 13 | Trical Inc. | 100–249 |
| 14 | West Marine | 100–249 |
Media and News
San Benito County gets news and entertainment from media outlets in Monterey County. There are also local media sources that serve the community directly.
Television Channels
CMAP TV is a community media group based in Gilroy. It runs Channels 17, 18, 19, and 20 on Charter/Spectrum Cable. You can also watch them online. They offer public access and educational shows for Gilroy and San Benito County. They also broadcast live meetings of the county government.
Radio Stations
Several radio stations serve the area:
- KMPG, at 1520 AM, plays regional Mexican music during the day.
- KQKE, at 97.5 FM, is "The Quake" San Benito County Community Radio. It has a low power signal.
- KHRI, at 90.7 FM, is an affiliate of Air 1. It plays contemporary Christian music.
- KXSM, at 93.1 FM, broadcasts regional Mexican music.
- K206BQ, at 89.1 FM, re-broadcasts KLVM.
- K265DG, at 100.9 FM, re-broadcasts KPRC-FM.
Print Newspapers
- The Hollister Free Lance newspaper started in 1873. It is published every Thursday. New SV Media, Inc. owns it now.
- Mission Village Voice is a monthly paper from San Juan Bautista. It focuses on arts, culture, and community events.
Online News
- BenitoLink is a nonprofit news website. It covers San Benito County and is run by local people.
- San Benito Live is a local news website. It mainly focuses on culture-related media.
Transportation
Main Highways
 U.S. Route 101 goes north to San Francisco.
 State Route 25
 State Route 129 goes west to Santa Cruz.
 State Route 146
 State Route 156
Public Transportation
San Benito County Express offers bus services. It has routes within Hollister and connects to other areas in the northern part of the county. You can even take a bus as far north as Gilroy in Santa Clara County.
Airports

Hollister Municipal Airport is an airport for smaller planes. It is located just north of Hollister.
Communities in San Benito County
Cities
- Hollister (This is the county seat, where the main county government offices are.)
- San Juan Bautista
Census-Designated Places (CDPs)
These are areas that are like towns but are not officially incorporated as cities.
Unincorporated Communities
These are smaller communities that are not part of any city or CDP.
- Bitterwater
- Dunneville
- Hudner
- Paicines
- Panoche
- River Oaks
- San Benito
- Tres Pinos
Ghost Town
- New Idria (This town was abandoned after its mine closed.)
Community Population Ranking (2010 Census)
This table shows the population of the main communities in San Benito County based on the 2010 census.
† county seat
| Rank | City/Town/etc. | Type | Population (2010 Census) |
|---|---|---|---|
| 1 | † Hollister | City | 34,928 |
| 2 | Ridgemark | CDP | 3,016 |
| 3 | Aromas (partially in Monterey County) | CDP | 2,650 |
| 4 | San Juan Bautista | City | 1,862 |
| 5 | Tres Pinos | CDP | 476 |
Images for kids
-
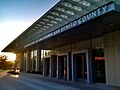
San Benito County Courthouse
-
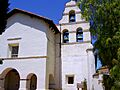
Mission San Juan Bautista
-
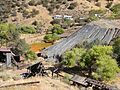
New Idria grounds
-
Flag of San Benito County
-
Seal of San Benito County
-
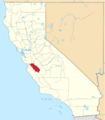
Location of San Benito County in California
See also
 In Spanish: Condado de San Benito para niños
