
Alameda County, California facts for kids
Quick facts for kids
Alameda County
|
|||
|---|---|---|---|
     Images, from top down, left to right: looking southwest across Lake Merritt in Oakland, Sather Tower on the UC Berkeley campus, a water tower in Hayward, Lake Elizabeth in Fremont, Pleasanton sign
|
|||
|
|||

Location in the state of California
|
|||
| Country | United States | ||
| State | California | ||
| Region | San Francisco Bay Area | ||
| Incorporated | March 25, 1853 | ||
| Named for | Rancho Arroyo de la Alameda (also see Alameda Creek) | ||
| County seat | Oakland | ||
| Largest city | Oakland (population) Fremont (area) |
||
| Government | |||
| • Type | Council–CAO | ||
| • Body | Alameda County Board of Supervisors | ||
| Area | |||
| • Total | 821 sq mi (2,130 km2) | ||
| • Land | 739 sq mi (1,910 km2) | ||
| • Water | 82 sq mi (210 km2) | ||
| Highest elevation | 3,843 ft (1,171 m) | ||
| Population
(2020)
|
|||
| • Total | 1,682,353 | ||
| • Estimate
(2023)
|
1,622,188 |
||
| • Density | 2,049.2/sq mi (791.2/km2) | ||
| GDP | |||
| • Total | $168.506 billion (2022) | ||
| Time zone | UTC-8 (Pacific Time Zone) | ||
| • Summer (DST) | UTC-7 (Pacific Daylight Time) | ||
| Area codes | 510, 341, 925 | ||
| FIPS code | 06-001 | ||
| Congressional districts | 10th, 12th, 14th, 17th | ||


Alameda County (say it: AL-ə-MEE-də) is a county in the state of California. It's located in the San Francisco Bay Area, mostly in the East Bay region. In 2020, about 1.68 million people lived here, making it the 7th most populated county in California. The main city and county seat is Oakland.
The name Alameda comes from a Spanish word. It means "a grove of poplars" or "a street lined with trees." Early Spanish explorers saw willow and sycamore trees along a creek here. They called it Arroyo de la Alameda. Today, that creek is known as Alameda Creek.
Contents
History of Alameda County
Alameda County was created on March 25, 1853. It was formed from parts of Contra Costa County and Santa Clara County.
When the county first started, its main office (county seat) was in Alvarado. This area is now part of Union City. In 1856, the county seat moved to San Leandro. But in 1868, an earthquake on the Hayward Fault destroyed the courthouse there.
From 1872 to 1875, the county seat was in Brooklyn. Brooklyn is now part of Oakland. Since 1873, Oakland has been the permanent county seat.
In the late 1800s and early 1900s, many areas here grew as "trolley car suburbs." People could live here and easily travel to San Francisco by trolley and ferry. Over time, this region changed from Native American lands and ranches to busy cities and suburbs.
Geography and Climate


Alameda County covers about 821 square miles. About 739 square miles are land, and 82 square miles (10%) are water. The San Francisco Bay is on the western side of the county.
The Berkeley Hills form part of the county's northeastern border. A flat area, called a coastal plain, runs along the bay. This is where most people in Oakland live. The Livermore Valley is in the eastern part of the county. The Amador Valley is next to it, stretching west to the Pleasanton Ridge. The Diablo Range has the county's highest mountains. This area is not very populated.
The Hayward Fault is a major earthquake fault line. It runs through the most populated parts of Alameda County. Another fault, the Calaveras Fault, is in the southeastern part of the county.
Areas near the Bay have a mild, wet winter and dry, warm summer climate. This is called a warm-summer Mediterranean climate. Areas further inland, like Livermore, have much hotter summers.
| Climate data for Oakland Museum (1981–2010 normals, extremes 1970–present) | |||||||||||||
|---|---|---|---|---|---|---|---|---|---|---|---|---|---|
| Month | Jan | Feb | Mar | Apr | May | Jun | Jul | Aug | Sep | Oct | Nov | Dec | Year |
| Record high °F (°C) | 78 (26) |
82 (28) |
88 (31) |
97 (36) |
105 (41) |
106 (41) |
103 (39) |
99 (37) |
109 (43) |
103 (39) |
84 (29) |
75 (24) |
109 (43) |
| Mean maximum °F (°C) | 67.0 (19.4) |
72.4 (22.4) |
75.9 (24.4) |
82.8 (28.2) |
85.5 (29.7) |
89.1 (31.7) |
87.3 (30.7) |
88.7 (31.5) |
89.7 (32.1) |
87.8 (31.0) |
75.8 (24.3) |
66.5 (19.2) |
94.7 (34.8) |
| Mean daily maximum °F (°C) | 58.0 (14.4) |
61.8 (16.6) |
63.6 (17.6) |
66.0 (18.9) |
68.8 (20.4) |
71.2 (21.8) |
71.7 (22.1) |
73.0 (22.8) |
74.1 (23.4) |
71.7 (22.1) |
64.6 (18.1) |
58.1 (14.5) |
66.6 (19.2) |
| Daily mean °F (°C) | 51.4 (10.8) |
54.7 (12.6) |
56.4 (13.6) |
58.3 (14.6) |
61.1 (16.2) |
63.5 (17.5) |
64.3 (17.9) |
65.6 (18.7) |
66.0 (18.9) |
63.3 (17.4) |
57.1 (13.9) |
51.8 (11.0) |
59.2 (15.1) |
| Mean daily minimum °F (°C) | 44.7 (7.1) |
47.7 (8.7) |
49.1 (9.5) |
50.5 (10.3) |
53.5 (11.9) |
55.7 (13.2) |
56.9 (13.8) |
58.1 (14.5) |
57.8 (14.3) |
55.1 (12.8) |
49.8 (9.9) |
45.4 (7.4) |
51.9 (11.1) |
| Mean minimum °F (°C) | 38.0 (3.3) |
40.0 (4.4) |
42.2 (5.7) |
45.2 (7.3) |
49.1 (9.5) |
51.9 (11.1) |
54.0 (12.2) |
55.5 (13.1) |
53.8 (12.1) |
49.0 (9.4) |
41.6 (5.3) |
37.3 (2.9) |
36.0 (2.2) |
| Record low °F (°C) | 30 (−1) |
29 (−2) |
34 (1) |
37 (3) |
43 (6) |
48 (9) |
51 (11) |
50 (10) |
48 (9) |
43 (6) |
36 (2) |
26 (−3) |
26 (−3) |
| Average precipitation inches (mm) | 4.59 (117) |
4.65 (118) |
3.52 (89) |
1.32 (34) |
0.73 (19) |
0.12 (3.0) |
0.00 (0.00) |
0.07 (1.8) |
0.23 (5.8) |
1.29 (33) |
3.07 (78) |
4.44 (113) |
24.09 (612) |
| Average precipitation days (≥ 0.01 in.) | 10.2 | 10.5 | 10.7 | 5.9 | 3.4 | 1.0 | 0.1 | 0.4 | 1.2 | 3.5 | 8.1 | 10.4 | 69.1 |
| Source: NOAA | |||||||||||||
| Climate data for Livermore, California (1903–2013) | |||||||||||||
|---|---|---|---|---|---|---|---|---|---|---|---|---|---|
| Month | Jan | Feb | Mar | Apr | May | Jun | Jul | Aug | Sep | Oct | Nov | Dec | Year |
| Record high °F (°C) | 77 (25) |
80 (27) |
88 (31) |
96 (36) |
108 (42) |
113 (45) |
113 (45) |
112 (44) |
115 (46) |
106 (41) |
93 (34) |
79 (26) |
113 (45) |
| Mean maximum °F (°C) | 66.9 (19.4) |
71.4 (21.9) |
77.9 (25.5) |
85.8 (29.9) |
94.3 (34.6) |
102.0 (38.9) |
104.3 (40.2) |
102.8 (39.3) |
101.2 (38.4) |
92.6 (33.7) |
79.0 (26.1) |
67.8 (19.9) |
106.3 (41.3) |
| Mean daily maximum °F (°C) | 56.8 (13.8) |
61.2 (16.2) |
65.2 (18.4) |
70.5 (21.4) |
76.4 (24.7) |
83.1 (28.4) |
89.0 (31.7) |
88.2 (31.2) |
86.0 (30.0) |
77.7 (25.4) |
66.3 (19.1) |
57.5 (14.2) |
73.2 (22.9) |
| Mean daily minimum °F (°C) | 36.7 (2.6) |
39.4 (4.1) |
41.3 (5.2) |
43.6 (6.4) |
47.6 (8.7) |
51.7 (10.9) |
54.2 (12.3) |
54.0 (12.2) |
52.5 (11.4) |
47.7 (8.7) |
41.1 (5.1) |
37.0 (2.8) |
45.6 (7.6) |
| Mean minimum °F (°C) | 26.4 (−3.1) |
29.5 (−1.4) |
32.1 (0.1) |
34.9 (1.6) |
39.3 (4.1) |
44.4 (6.9) |
47.7 (8.7) |
47.8 (8.8) |
44.5 (6.9) |
38.3 (3.5) |
30.5 (−0.8) |
26.7 (−2.9) |
24.5 (−4.2) |
| Record low °F (°C) | 18 (−8) |
21 (−6) |
22 (−6) |
29 (−2) |
32 (0) |
38 (3) |
36 (2) |
36 (2) |
35 (2) |
29 (−2) |
22 (−6) |
18 (−8) |
18 (−8) |
| Average precipitation inches (mm) | 2.97 (75) |
2.47 (63) |
2.15 (55) |
1.00 (25) |
.44 (11) |
.11 (2.8) |
.02 (0.51) |
.04 (1.0) |
.22 (5.6) |
.67 (17) |
1.54 (39) |
2.56 (65) |
14.19 (359.91) |
| Average precipitation days (≥ .01 in) | 10 | 9 | 9 | 6 | 3 | 1 | 0 | 0 | 1 | 3 | 7 | 9 | 58 |
| Average snowy days | trace | 0.0 | 0.0 | 0.0 | 0.0 | 0.0 | 0.0 | 0.0 | 0.0 | 0.0 | 0.0 | 0.1 | 0.1 |
| Source: WRCC and pogodaiklimat.ru | |||||||||||||
Neighboring Counties
Alameda County shares borders with several other counties:
- San Francisco (to the west)
- Santa Clara County (to the south)
- San Joaquin County (to the east)
- Contra Costa County (to the north)
- Stanislaus County (a very small border to the southeast)
Protected Natural Areas
Part of the Don Edwards San Francisco Bay National Wildlife Refuge is located in Alameda County. This area helps protect wildlife and their homes.
People and Population
| Historical population | |||
|---|---|---|---|
| Census | Pop. | %± | |
| 1860 | 8,927 | — | |
| 1870 | 24,237 | 171.5% | |
| 1880 | 62,976 | 159.8% | |
| 1890 | 93,864 | 49.0% | |
| 1900 | 130,197 | 38.7% | |
| 1910 | 246,131 | 89.0% | |
| 1920 | 344,177 | 39.8% | |
| 1930 | 474,883 | 38.0% | |
| 1940 | 513,011 | 8.0% | |
| 1950 | 740,315 | 44.3% | |
| 1960 | 908,209 | 22.7% | |
| 1970 | 1,073,184 | 18.2% | |
| 1980 | 1,105,379 | 3.0% | |
| 1990 | 1,279,182 | 15.7% | |
| 2000 | 1,443,741 | 12.9% | |
| 2010 | 1,510,271 | 4.6% | |
| 2020 | 1,682,353 | 11.4% | |
| 2023 (est.) | 1,622,188 | 7.4% | |
| U.S. Decennial Census 1790–1960 1900–1990 1990–2000 2010 2020 |
|||
Alameda County is known for being very diverse. This means people from many different backgrounds live here.
Population in 2020
In the 2020 census, Alameda County had 1,682,353 people. Here's a look at the different groups:
| Race / Ethnicity (NH = Non-Hispanic) | Pop 2000 | Pop 2010 | Pop 2020 | % 2000 | % 2010 | % 2020 |
|---|---|---|---|---|---|---|
| White alone (NH) | 591,095 | 514,559 | 472,277 | 40.94% | 34.07% | 28.07% |
| Black or African American alone (NH) | 211,124 | 184,126 | 159,499 | 14.62% | 12.19% | 9.48% |
| Native American or Alaska Native alone (NH) | 5,306 | 4,189 | 4,131 | 0.37% | 0.28% | 0.25% |
| Asian alone (NH) | 292,673 | 390,524 | 540,511 | 20.27% | 25.86% | 32.13% |
| Pacific Islander alone (NH) | 8,458 | 11,931 | 13,209 | 0.59% | 0.79% | 0.79% |
| Other Race alone (NH) | 4,676 | 4,191 | 10,440 | 0.32% | 0.28% | 0.62% |
| Mixed Race or Multi-Racial (NH) | 56,499 | 60,862 | 88,537 | 3.91% | 4.03% | 5.26% |
| Hispanic or Latino (any race) | 273,910 | 339,889 | 393,749 | 18.97% | 22.51% | 23.40% |
| Total | 1,443,741 | 1,510,271 | 1,682,353 | 100.00% | 100.00% | 100.00% |
In 2014, a study found Alameda County to be the fourth most racially diverse county in the United States. It was also the most diverse county in California. The 2020 census shows that Alameda County has one of the highest percentages of Asian residents. It is one of the only counties in the continental U.S. where Asian people make up the largest group. This group includes many people of Chinese, Indian, and Filipino backgrounds.
Population Breakdown (2019)

Here's a look at the different groups in Alameda County based on 2019 estimates:
- White: 38.8% (this includes people who identify as both White and Hispanic)
- Asian: 31.1%
- Some Other Race: 11.5%
- Black or African American: 10.7%
- Two or more races: 6.4%
- Native American and Alaskan Native: 0.8%
- Pacific Islander: 0.8%
Racial Makeup of Alameda County (2019) White alone (38.84%) Black alone (10.66%) Native American alone (0.76%) Asian Alone (31.13%) Pacific Islander Alone (0.81%) Other race alone (11.45%) Two or more races (6.35%)
Racial Makeup of Alameda County excluding Hispanics from racial categories (2019)
NH=Non-Hispanic White alone (30.43%) Black alone (10.33%) Native American alone (0.33%) Asian Alone (30.93%) Pacific Islander Alone (0.77%) Other race alone (0.47%) Two or more races (4.41%) Hispanic Any Race (22.32%)
Racial Makeup of Hispanics in Alameda County (2019) White alone (37.69%) Black alone (1.48%) Native American alone (1.91%) Asian alone (0.89%) Pacific Islander alone (0.17%) Other race alone (49.16%) Two or more races (8.69%)
Asian Americans are now the largest racial group in Alameda County. White Non-Hispanic Americans are the largest minority group. About 22.3% of the population is Hispanic-Latino. This group is the third largest minority group in the county. Most Hispanics in Alameda County are of Mexican descent.
Education in Alameda County
The Alameda County Office of Education helps oversee 17 school districts for students from kindergarten to 12th grade. They also help three community college districts. About 10,000 teachers work with 225,000 students in the county.
The Alameda County Library has libraries in several cities and communities. Some cities, like Oakland and Berkeley, have their own separate library systems.
Colleges and Universities
Alameda County is home to many colleges and universities. One of the most famous is the University of California, Berkeley. It's a very large and important research university.
Other colleges and universities include:
- Berkeley City College
- California State University, East Bay
- Chabot College
- College of Alameda
- Graduate Theological Union
- Laney College
- Las Positas College
- Merritt College
- Mills College at Northeastern University
- Ohlone College
- Samuel Merritt University
Public School Districts
Here are some of the school districts in Alameda County:
- Alameda Unified School District
- Albany Unified School District
- Berkeley Unified School District
- Castro Valley Unified School District
- Dublin Unified School District
- Emery Unified School District
- Fremont Unified School District
- Hayward Unified School District
- Livermore Valley Joint Unified School District
- New Haven Unified School District
- Newark Unified School District
- Oakland Unified School District
- Piedmont Unified School District
- Pleasanton Unified School District
- San Leandro Unified School District
- San Lorenzo Unified School District
- Sunol Glen Unified School District
Arts and Culture
The Alameda County Arts Commission works to support and promote the arts in the county. The Oakland Museum of California has a large collection of California art and historical items.
Sports Teams
Here are some sports teams that play in Alameda County:
| Club | Sport | Founded | League | Venue |
|---|---|---|---|---|
| California Golden Bears | NCAA | 1868 | NCAA: ACC | California Memorial Stadium (Football), Haas Pavilion (Basketball), Evans Diamond (Baseball) |
| East Bay FC Stompers | Soccer | 2012 (in San Francisco from 2012 to 2015) | National Premier Soccer League: Golden Gate Conference | Pioneer Stadium |
| Oakland Roots | Soccer | 2018 | USL Championship | Pioneer Stadium |
Fun Events
The county hosts an annual fair at the Alameda County Fairgrounds in Pleasanton. The fair takes place for four weekends from June to July. You can enjoy horse racing, carnival rides, 4-H exhibits, and live music.
Parks and Outdoor Fun
Alameda County has over 350 parks! The East Bay Regional Park District manages many of these parks. Some popular ones include Tilden Regional Park, Redwood Regional Park, and Coyote Hills Regional Park. The San Francisco Bay Trail is a path that will run along the bay shore in the county.
Getting Around (Transportation)
Main Roads
 Interstate 80
 Interstate 205
 Interstate 238
 Interstate 580
 Interstate 680
 Interstate 880
 Interstate 980
 State Route 13
 State Route 24
 State Route 61
 State Route 77
 State Route 84
 State Route 92
 State Route 123
 State Route 185
 State Route 238
 State Route 262
Public Transportation
Trains
- Altamont Corridor Express (ACE): A train for people commuting from San Joaquin County.
- Amtrak: Long-distance trains like the California Zephyr and Coast Starlight stop here. The Capitol Corridor and San Joaquins also serve the county.
- Bay Area Rapid Transit (BART): A subway and elevated train system that connects many cities in the Bay Area, including Oakland and San Francisco.
- Valley Link: A planned train service for the future.
Buses
- AC Transit: The main local bus system in western Alameda County. It also connects to San Francisco.
- WHEELS: A bus system for cities in southeastern Alameda County.
- Other local bus services include Union City Transit and Emery-Go-Round.
Ferries
- Alameda / Oakland Ferry and Harbor Bay Ferry: These ferries connect Oakland, Alameda, and Bay Farm Island to downtown San Francisco by water.
Airports
The main airport in the county is the Oakland International Airport. There are also two smaller airports for general aviation: the Hayward Executive Airport and Livermore Municipal Airport.
Community Services
Alameda Health System runs the public health system in the county. They operate five hospitals and several clinics. The Alameda County Community Food Bank helps provide food for residents. The Family Emergency Shelter Coalition helps homeless families.
Important Landmarks
Alameda County has many important historical places. Eight of them are National Historic Landmarks. These include:
- The Abbey, Joaquin Miller House
- First Church of Christ, Scientist
- USS Hornet (CVS-12) (an aircraft carrier)
- Lake Merritt Wild Duck Refuge
- Lightship WAL-605, Relief (a lightship)
- Paramount Theatre
- Potomac (Presidential yacht)
- Room 307, Gilman Hall, University of California
The county also has many other places listed on the National Register of Historic Places and California Historical Landmarks.
Sister County
Alameda County has a "sister county" relationship with Taoyuan City in Taiwan.
Cities and Communities

Cities
| No. on Map |
City | Year incorporated |
Population, 2020 |
|---|---|---|---|
| 1 | Alameda | 1854 | 78,280 |
| 2 | Albany | 1908 | 20,271 |
| 3 | Berkeley | 1878 | 124,321 |
| 4 | Dublin | 1982 | 72,589 |
| 5 | Emeryville | 1896 | 12,905 |
| 6 | Fremont | 1956 | 230,504 |
| 7 | Hayward | 1876 | 162,954 |
| 8 | Livermore | 1876 | 87,955 |
| 9 | Newark | 1955 | 47,529 |
| 10 | Oakland (county seat) | 1852 | 440,646 |
| 11 | Piedmont | 1907 | 11,270 |
| 12 | Pleasanton | 1894 | 79,871 |
| 13 | San Leandro | 1872 | 91,008 |
| 14 | Union City | 1959 | 70,143 |
Census-Designated Places (CDPs)
These are areas that are like towns but are not officially incorporated as cities.
Unincorporated Communities
These are smaller communities that are not part of any city or CDP.
Population Ranking of Communities
This table shows the population of cities and CDPs in Alameda County, based on the 2020 census.
† county seat
| Rank | City/Town/etc. | Municipal type | Population (2020 Census) |
|---|---|---|---|
| 1 | † Oakland | City | 440,646 |
| 2 | Fremont | City | 230,504 |
| 3 | Hayward | City | 162,954 |
| 4 | Berkeley | City | 124,321 |
| 5 | San Leandro | City | 91,008 |
| 6 | Livermore | City | 87,955 |
| 7 | Pleasanton | City | 79,871 |
| 8 | Alameda | City | 78,280 |
| 9 | Dublin | City | 72,589 |
| 10 | Union City | City | 70,143 |
| 11 | Castro Valley | CDP | 66,441 |
| 12 | Newark | City | 47,529 |
| 13 | San Lorenzo | CDP | 29,581 |
| 14 | Ashland | CDP | 23,823 |
| 15 | Albany | City | 20,271 |
| 16 | Cherryland | CDP | 15,808 |
| 17 | Emeryville | City | 12,905 |
| 18 | Fairview | CDP | 11,341 |
| 19 | Piedmont | City | 11,270 |
| 20 | Sunol | CDP | 922 |
Images for kids
-
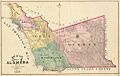
Map of Alameda County, 1878 (Six Townships)

See Also
 In Spanish: Condado de Alameda para niños
