
Stanislaus County, California facts for kids
Quick facts for kids
Stanislaus County, California
|
||
|---|---|---|
| County of Stanislaus Spanish: Condado de Estanislao |
||
   Images, from top down, left to right: Modesto Arch, Knights Ferry's General Store, a view of the Tuolumne River from Waterford
|
||
|
||
| Motto(s):
"Striving to be the best!"
|
||

Location in California
|
||
| Country | United States | |
| State | California | |
| Region | San Joaquin Valley | |
| Incorporated | April 1, 1854 | |
| Named for | Estanislao | |
| County seat (and largest city) | Modesto | |
| Government | ||
| • Type | Council–CEO | |
| • Body | Board of Supervisors | |
| Area | ||
| • Total | 1,515 sq mi (3,920 km2) | |
| • Land | 1,495 sq mi (3,870 km2) | |
| • Water | 20 sq mi (50 km2) | |
| Highest elevation | 3,807 ft (1,160 m) | |
| Population
(2020)
|
||
| • Total | 552,878 | |
| • Density | 364.94/sq mi (140.90/km2) | |
| GDP | ||
| • Total | $28.674 billion (2022) | |
| Time zone | UTC−8 (Pacific Time Zone) | |
| • Summer (DST) | UTC−7 (Pacific Daylight Time) | |
| Area code | 209 | |
| FIPS code | 06-099 | |
| GNIS feature ID | 277314 | |
| Congressional districts | 5th, 9th, 13th | |

Stanislaus County is a county in the San Joaquin Valley of California. As of 2023, about 564,404 people live here. The main city and county seat is Modesto.
Stanislaus County is part of the Modesto metropolitan area. It is located just east of the San Francisco Bay Area. Many people who work in the Bay Area choose to live in Stanislaus County because homes are more affordable.
Contents
History of Stanislaus County
The first European to explore this area was Gabriel Moraga in 1806.
How Stanislaus County Got Its Name
The county is named after the Estanislao River. The river was named after Estanislao, a Native American chief. He led battles against Mexican troops in the 1820s. He was defeated by General Mariano Vallejo in 1826. Estanislao was his baptismal name, given after Saint Stanislaus the Martyr.
Early Land Grants
Between 1843 and 1846, when California was part of Mexico, five large land grants were given in Stanislaus County. These grants covered over 113,000 acres. They included areas on both sides of the San Joaquin and Stanislaus Rivers.
When the County Was Formed
Stanislaus County was created in 1854 from a part of Tuolumne County. The county seat, which is the main government city, moved several times. It was first in Adamsville, then Empire, La Grange, and Knights Ferry. Finally, in 1871, it was set in Modesto, where it remains today.
Growth and Housing
Over time, housing prices in the San Francisco Bay Area have gone up a lot. This has led many people to move to Stanislaus County. They choose to live here for the more affordable homes, even if it means a longer trip to work.
Geography of Stanislaus County
Stanislaus County covers about 1,515 square miles. About 20 square miles of this area is water.
The San Joaquin River's Impact
The San Joaquin River flows north through the county. Historically, this river divided the county socially and economically. The area west of the river, known as the "West Side," has mostly remained rural. It depends on farming. This is because it was separated from the main rail lines and irrigation projects.
Some towns on the West Side, like Patterson and Newman, have grown a lot. They are becoming "bedroom communities" for people who work in the Bay Area. Other small farming towns, like Westley and Crows Landing, have not seen as much growth.
Plants and Animals
Stanislaus County is home to some rare and endangered species.
- The beaked clarkia (Clarkia rostrata) is a plant that might become federally endangered. It grows in the foothills of the Sierra Nevada mountains.
- Colusa grass (Neostapfsia colusana) is listed as endangered by the state. It only grows in special wetlands called vernal pools.
Protected Natural Areas
Part of the San Joaquin River National Wildlife Refuge is located in Stanislaus County. This area helps protect wildlife.
Transportation in Stanislaus County
Main Roads
Many important highways run through Stanislaus County:
 Interstate 5
 State Route 4
 State Route 33
 State Route 99
 State Route 108
 State Route 120
 State Route 132
 State Route 165
 State Route 219
Public Transport
- The Stanislaus Regional Transit Authority runs local buses in Modesto. It also offers regional service across the county. There are even commuter services to connect with trains like Bay Area Rapid Transit and Altamont Corridor Express.
- Smaller bus systems operate in cities like Ceres, Oakdale, Riverbank, and Turlock.
- Both Greyhound buses and Amtrak trains have stops in Modesto and Turlock. The Amtrak stop for Turlock is actually in Denair.
Airports
The Modesto City-County Airport used to have regular passenger flights. Now, it is mainly used for general aviation. Other smaller airports in the county include Oakdale Airport, Patterson Airport, and Turlock Airpark.
Population and People
| Historical population | |||
|---|---|---|---|
| Census | Pop. | %± | |
| 1860 | 2,245 | — | |
| 1870 | 6,499 | 189.5% | |
| 1880 | 8,751 | 34.7% | |
| 1890 | 10,040 | 14.7% | |
| 1900 | 9,550 | −4.9% | |
| 1910 | 22,522 | 135.8% | |
| 1920 | 43,557 | 93.4% | |
| 1930 | 56,641 | 30.0% | |
| 1940 | 74,866 | 32.2% | |
| 1950 | 127,231 | 69.9% | |
| 1960 | 157,294 | 23.6% | |
| 1970 | 194,506 | 23.7% | |
| 1980 | 265,900 | 36.7% | |
| 1990 | 370,522 | 39.3% | |
| 2000 | 446,997 | 20.6% | |
| 2010 | 514,453 | 15.1% | |
| 2020 | 552,878 | 7.5% | |
| 2023 (est.) | 551,430 | 7.2% | |
| U.S. Decennial Census 1790-1960 1900-1990 1990-2000 2010 2020 |
|||
Population in 2020
In 2020, Stanislaus County had a population of 552,878 people. The county is very diverse.
| Race / Ethnicity (NH = Non-Hispanic) | Pop 2010 | Pop 2020 | % 2010 | % 2020 |
|---|---|---|---|---|
| White alone (NH) | 240,423 | 207,908 | 46.73% | 37.60% |
| Black or African American alone (NH) | 13,065 | 14,302 | 2.54% | 2.59% |
| Native American or Alaska Native alone (NH) | 2,870 | 2,621 | 0.56% | 0.47% |
| Asian alone (NH) | 24,712 | 33,169 | 4.80% | 6.00% |
| Pacific Islander alone (NH) | 3,016 | 3,713 | 0.59% | 0.67% |
| Other race alone (NH) | 842 | 2,734 | 0.16% | 0.49% |
| Mixed race or Multiracial (NH) | 13,867 | 22,453 | 2.70% | 4.06% |
| Hispanic or Latino (any race) | 215,658 | 265,978 | 41.92% | 48.11% |
| Total | 514,453 | 552,878 | 100.00% | 100.00% |
Population in 2010
The 2010 census showed that Stanislaus County had 514,453 people.
- About 65.6% were White.
- About 2.9% were African American.
- About 5.1% were Asian.
- About 41.9% of the population was Hispanic or Latino. This group includes people of any race.
Economy of Stanislaus County
The most important industry in Stanislaus County is farming. The main product grown here is almonds.
Education in Stanislaus County
Colleges and Universities
- California State University, Stanislaus is a university campus in Turlock.
- The Yosemite Community College District serves a large area. It includes Modesto Junior College in Modesto. It also includes Columbia College in Sonora.
- Other colleges like Kaplan College and San Joaquin Valley College have campuses in Modesto.
Schools for Kids (K-12)
Stanislaus County has many school districts. They help students from kindergarten through 12th grade.
- Unified School Districts (serve all grades):
- Ceres Unified School District
- Denair Unified School District
- Hughson Unified School District
- Newman-Crows Landing Unified School District
- Oakdale Joint Unified School District
- Patterson Joint Unified School District
- Riverbank Unified School District
- Turlock Unified School District
- Waterford Unified School District
- Secondary School District (high school only):
- Modesto City High School District
- Elementary School Districts (younger grades only):
- Chatom Union Elementary School District
- Empire Union Elementary School District
- Gratton Elementary School District
- Hart-Ransom Union Elementary School District
- Hickman Community Charter School District
- Keyes Union Elementary School District
- Knights Ferry Elementary School District
- Modesto City Elementary School District
- Paradise Elementary School District
- Roberts Ferry Union Elementary School District
- Salida Union Elementary School District
- Shiloh Elementary School District
- Stanislaus Union Elementary School District
- Sylvan Union Elementary School District
- Valley Home Joint Elementary School District
Media in Stanislaus County
Stanislaus County gets its main TV channels from the Sacramento area.
There are also local news sources:
- The Modesto Press is an online news site. It covers Modesto and the nearby Central Valley.
- The Modesto Bee is a daily newspaper based in Modesto.
Communities in Stanislaus County
Cities
Census-Designated Places (CDPs)
CDPs are areas that are like towns but are not officially incorporated as cities.
- Airport
- Bret Harte
- Bystrom
- Cowan
- Crows Landing
- Del Rio
- Denair
- Diablo Grande
- East Oakdale
- Empire
- Grayson
- Hickman
- Keyes
- Knights Ferry
- La Grange
- Monterey Park Tract
- Orange Blossom
- Parklawn
- Riverdale Park
- Rouse
- Salida
- Valley Home
- West Modesto
- Westley
Other Communities (Not Incorporated)
These are smaller communities that are not officially cities or CDPs.
- Eugene
- Hills Ferry
- Langworth
- McHenry
- Montpelier
- Mountain View
- Oso
- Roberts Ferry
- Timba (or Orestimba)
- Tuolumne
- Wood Colony
Images for kids
-
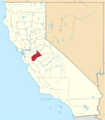
Location of Stanislaus County in California
See also
 In Spanish: Condado de Stanislaus para niños
