
United States presidential election in California, 2016 facts for kids

The 2016 United States presidential election in California was an important event where people in California voted for the next President of the United States. This election happened on November 8, 2016. It was part of the larger 2016 United States presidential election where all states and Washington, D.C. also voted.
Before the main election, on June 7, 2016, people in California also voted in special elections called "primaries." These primary elections helped decide which candidates would represent the main political parties, like the Democratic and Republican parties, in the big presidential election.
Contents
Presidential Election Results

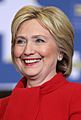
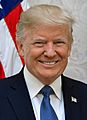
In the 2016 presidential election, voters in California chose between several candidates. The main candidates were Hillary Clinton from the Democratic Party and Donald Trump from the Republican Party.
How California Voted
California is a state that usually votes for Democratic candidates. In 2016, Hillary Clinton won the most votes in California. She received over 5.4 million votes. Donald Trump received almost 3 million votes.
Here are the final results for the main candidates:
| Presidential Election in California | ||
|---|---|---|
| Choice | Votes | % |
| Hillary Clinton | 5,488,261 | 61.46% |
| Donald Trump | 2,969,532 | 33.25% |
| Gary Johnson | 281,922 | 3.2% |
| Jill Stein | 152,539 | 1.7% |
| Gloria La Riva | 38,205 | 0.4% |
| Total votes | 9,021,979 | 100% |
Primary Elections
Before the main election, political parties hold "primary elections." These are like tryouts where people vote for who they want to be their party's official candidate for president. California held its primary elections on June 7, 2016.
Democratic Primary

In the Democratic primary, the two main candidates were Hillary Clinton and Bernie Sanders. Hillary Clinton won the primary in California. This meant she got more "delegates" from California to support her at the Democratic Party's national meeting. Delegates are like representatives who vote for a candidate.
Here's how the votes were split:
| California Democratic Primary, June 7, 2016 | |||||
|---|---|---|---|---|---|
| Candidate | Popular vote | Estimated delegates | |||
| Count | Percentage | Pledged | Unpledged | Total | |
| Hillary Clinton | 2,745,302 | 53.07% | 254 | 66 | 320 |
| Bernie Sanders | 2,381,722 | 46.04% | 221 | 0 | 221 |
| Willie Wilson | 12,014 | 0.23% | |||
| Michael Steinberg | 10,880 | 0.21% | |||
| Rocky De La Fuente | 8,453 | 0.16% | |||
| Henry Hewes | 7,743 | 0.15% | |||
| Keith Russell Judd | 7,201 | 0.14% | |||
| write-in | 23 | 0.00% | |||
| Uncommitted | N/A | 10 | 10 | ||
| Total | 5,173,338 | 100% | 475 | 76 | 551 |
| Source: The Green Papers | |||||
How Counties Voted in the Democratic Primary
The map shows how each county in California voted. Yellow means Hillary Clinton won that county. Green means Bernie Sanders won that county.
| County | Clinton | Votes | Sanders | Votes |
|---|---|---|---|---|
| Alameda | 51.5% | 164,889 | 48.0% | 153,955 |
| Alpine | 44.8% | 113 | 54.4% | 137 |
| Amador | 50.4% | 2,516 | 47.8% | 2,386 |
| Butte | 37.0% | 11,766 | 62.0% | 19,739 |
| Calaveras | 49.5% | 2,971 | 48.5% | 2,914 |
| Colusa | 49.3% | 835 | 47.8% | 809 |
| Contra Costa | 56.7% | 103,333 | 42.7% | 77,862 |
| Del Norte | 40.4% | 1,119 | 57.6% | 1,598 |
| El Dorado | 49.1% | 12,492 | 49.6% | 12,620 |
| Fresno | 56.0% | 45,436 | 42.7% | 34,663 |
| Glenn | 46.8% | 911 | 51.5% | 1,003 |
| Humboldt | 28.7% | 8,135 | 70.4% | 19,928 |
| Imperial | 65.0% | 9,843 | 33.7% | 5,111 |
| Inyo | 42.5% | 1,001 | 55.7% | 1,313 |
| Kern | 54.1% | 28,806 | 43.9% | 23,374 |
| Kings | 57.8% | 4,150 | 39.9% | 2,869 |
| Lake | 42.7% | 3,988 | 55.7% | 5,195 |
| Lassen | 42.6% | 812 | 53.7% | 1,023 |
| Los Angeles | 54.4% | 780,013 | 44.6% | 639,886 |
| Madera | 53.1% | 5,808 | 44.4% | 4,852 |
| Marin | 56.4% | 43,283 | 43.3% | 33,214 |
| Mariposa | 44.1% | 1,102 | 54.2% | 1,355 |
| Mendocino | 32.8% | 6,048 | 66.5% | 12,259 |
| Merced | 53.0% | 10,839 | 45.3% | 9,273 |
| Modoc | 42.3% | 281 | 52.5% | 349 |
| Mono | 43.3% | 799 | 56.2% | 1,038 |
| Monterey | 52.8% | 29,730 | 46.3% | 26,073 |
| Napa | 53.4% | 13,583 | 45.9% | 11,682 |
| Nevada | 36.9% | 8,175 | 62.4% | 13,827 |
| Orange | 51.9% | 171,593 | 47.3% | 156,235 |
| Placer | 54.1% | 25,249 | 44.8% | 20,916 |
| Plumas | 44.1% | 1,211 | 53.7% | 1,475 |
| Riverside | 56.1% | 112,526 | 42.8% | 85,918 |
| Sacramento | 54.6% | 109,898 | 44.4% | 89,428 |
| San Benito | 54.3% | 4,112 | 44.6% | 3,380 |
| San Bernardino | 54.6% | 96,076 | 44.2% | 77,706 |
| San Diego | 51.6% | 215,655 | 47.7% | 199,716 |
| San Francisco | 53.6% | 116,359 | 45.9% | 99,594 |
| San Joaquin | 56.5% | 38,212 | 42.2% | 28,523 |
| San Luis Obispo | 46.7% | 21,637 | 52.6% | 24,379 |
| San Mateo | 58.7% | 79,756 | 40.8% | 55,367 |
| Santa Barbara | 46.9% | 31,927 | 52.4% | 35,717 |
| Santa Clara | 57.5% | 159,480 | 41.9% | 116,193 |
| Santa Cruz | 40.5% | 29,520 | 59.0% | 42,940 |
| Shasta | 45.4% | 7,809 | 52.4% | 9,026 |
| Sierra | 42.5% | 224 | 56.4% | 297 |
| Siskiyou | 38.0% | 2,466 | 60.0% | 3,894 |
| Solano | 55.3% | 34,231 | 43.8% | 27,122 |
| Sonoma | 47.3% | 55,595 | 52.0% | 61,167 |
| Stanislaus | 51.2% | 24,359 | 47.1% | 22,384 |
| Sutter | 52.7% | 4,023 | 45.4% | 3,463 |
| Tehama | 45.9% | 2,372 | 51.4% | 2,655 |
| Trinity | 35.1% | 672 | 63.3% | 1,211 |
| Tulare | 54.4% | 13,472 | 43.7% | 10,834 |
| Tuolumne | 48.2% | 3,433 | 50.5% | 3,592 |
| Ventura | 51.2% | 60,615 | 47.9% | 56,751 |
| Yolo | 48.2% | 17,655 | 51.3% | 18,761 |
| Yuba | 45.1% | 2,388 | 52.4% | 2,771 |
| Total | 53.1% | 2,745,302 | 46.0% | 2,381,722 |
Republican Primary

In the Republican primary, Donald Trump won by a large amount. This meant he became the Republican Party's official candidate for president.
Here are the results for the Republican primary:
Quick facts for kids California Republican Primary, June 7, 2016 |
|||||
|---|---|---|---|---|---|
| Candidate | Votes | Percentage | Actual delegate count | ||
| Bound | Unbound | Total | |||
| Donald Trump | 1,665,135 | 74.76% | 172 | 0 | 172 |
| John Kasich (withdrawn) | 252,544 | 11.34% | 0 | 0 | 0 |
| Ted Cruz (withdrawn) | 211,576 | 9.50% | 0 | 0 | 0 |
| Ben Carson (withdrawn) | 82,259 | 3.69% | 0 | 0 | 0 |
| Jim Gilmore (withdrawn) | 15,691 | 0.70% | 0 | 0 | 0 |
| Write-ins | 101 | 0.00% | 0 | 0 | 0 |
| Unprojected delegates: | 0 | 0 | 0 | ||
| Total: | 2,227,306 | 100.00% | 172 | 0 | 172 |
| Source: The Green Papers | |||||
Images for kids
-
Hillary Clinton
-
Donald Trump

.jpg)
See also
 In Spanish: Elecciones presidenciales de Estados Unidos en California de 2016 para niños
