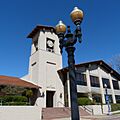
Folsom, California facts for kids
Quick facts for kids
Folsom, California
|
|||||
|---|---|---|---|---|---|
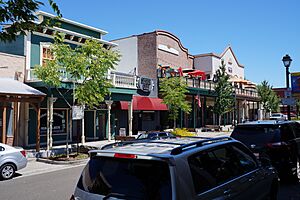
Historic Sutter Street
|
|||||
|
|||||
| Motto(s):
"Distinctive by Nature"
|
|||||
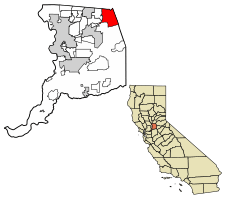
Location of Folsom in Sacramento County, California
|
|||||
| Country | United States | ||||
| State | California | ||||
| County | Sacramento | ||||
| Incorporated | April 20, 1946 | ||||
| Area | |||||
| • Total | 30.15 sq mi (78.09 km2) | ||||
| • Land | 27.88 sq mi (72.21 km2) | ||||
| • Water | 2.27 sq mi (5.88 km2) 9.69% | ||||
| Elevation | 220 ft (70 m) | ||||
| Population
(2020)
|
|||||
| • Total | 80,454 | ||||
| • Rank | 94th in California | ||||
| • Density | 2,668.5/sq mi (1,030.27/km2) | ||||
| Time zone | UTC−8 (PST) | ||||
| • Summer (DST) | UTC−7 (PDT) | ||||
| ZIP Codes |
95630, 95671, 95763
|
||||
| Area codes | 916/279 | ||||
| FIPS code | 06-24638 | ||||
| GNIS feature IDs | 277516, 2410516 | ||||
Folsom is a city in Sacramento County, California, United States. It's known for its history and beautiful natural areas. In 2020, about 80,454 people lived here. This number grew from 72,203 residents in 2010.
Contents
A Look at Folsom's Past
The Nisenan tribe of Native Americans lived in the Folsom area for a long time. The Gold Rush of 1849 brought many changes to their way of life.
Joseph Libbey Folsom bought land here and started a town called Granite City. Gold miners came hoping to find riches in the Sierra Nevada foothills. Joseph Folsom helped the town grow by getting a railway built to connect it with Sacramento. After he passed away in 1855, Granite City was renamed Folsom in his honor. The old railway line was later turned into a light rail service in 2005. Some old gold-rush towns, like Prairie City and Mormon Island, are now part of Folsom.
Folsom once had a large Chinese American community. Sadly, in 1886, a fire destroyed Folsom's Chinatown. This caused many Chinese Americans to leave the town.
Folsom Prison and Powerhouse
Folsom Prison was built in 1880. The Livermore family gave land for the prison. In return, they used prison workers to help build a hydro-electric dam on the American River. This dam helped create the Folsom Powerhouse. When it opened, it sent electricity 22 miles away to Sacramento. This was the longest distance for electricity transmission in the country at that time. The powerhouse worked until 1952.
Folsom Dam was built in 1956. It helps control floods and provides water for the Sacramento Valley. The dam also created Folsom Lake. The lake is about 4.8 miles (7.7 km) long from Granite Bay to its southern tip.
Folsom is home to Folsom Lake College, Folsom High School, and Vista del Lago High School. It also has a historic downtown area. Intel, a big technology company, is the largest private employer in the Sacramento area and has a large office in Folsom.
Future Growth
The Folsom Plan Area is a new development project. It will add about 11,000 new homes. This means about 25,000 more people will live in Folsom. This plan will make the city about one-third larger. It includes new homes, schools, parks, and office buildings.
Geography and Climate
Folsom covers about 34 square miles (88 square kilometers). Most of this area is land, but about 9.69% is water. Folsom is located in the foothills of the Sierra Nevada mountains.
Carpenter Hill in Folsom is the highest point in all of Sacramento County.
Weather in Folsom
Folsom has a climate with long, hot, and dry summers. The winters are cool and rainy.
| Climate data for Folsom, California (Folsom Dam), 1981–2010 normals | |||||||||||||
|---|---|---|---|---|---|---|---|---|---|---|---|---|---|
| Month | Jan | Feb | Mar | Apr | May | Jun | Jul | Aug | Sep | Oct | Nov | Dec | Year |
| Record high °F (°C) | 78 (26) |
78 (26) |
88 (31) |
98 (37) |
111 (44) |
115 (46) |
119 (48) |
115 (46) |
115 (46) |
102 (39) |
93 (34) |
75 (24) |
119 (48) |
| Mean maximum °F (°C) | 66 (19) |
72 (22) |
77 (25) |
86 (30) |
96 (36) |
104 (40) |
107 (42) |
106 (41) |
101 (38) |
92 (33) |
77 (25) |
66 (19) |
107 (42) |
| Mean daily maximum °F (°C) | 54 (12) |
61 (16) |
65 (18) |
72 (22) |
81 (27) |
89 (32) |
94 (34) |
94 (34) |
88 (31) |
79 (26) |
62 (17) |
54 (12) |
74 (23) |
| Daily mean °F (°C) | 45.5 (7.5) |
51.5 (10.8) |
55.0 (12.8) |
60.0 (15.6) |
66.5 (19.2) |
73.5 (23.1) |
77.5 (25.3) |
77.0 (25.0) |
72.5 (22.5) |
66.0 (18.9) |
52.5 (11.4) |
46.5 (8.1) |
62.0 (16.7) |
| Mean daily minimum °F (°C) | 37 (3) |
42 (6) |
45 (7) |
48 (9) |
52 (11) |
58 (14) |
61 (16) |
60 (16) |
57 (14) |
53 (12) |
43 (6) |
39 (4) |
50 (10) |
| Mean minimum °F (°C) | 28 (−2) |
32 (0) |
36 (2) |
39 (4) |
43 (6) |
50 (10) |
53 (12) |
54 (12) |
51 (11) |
43 (6) |
34 (1) |
29 (−2) |
26 (−3) |
| Record low °F (°C) | 15 (−9) |
19 (−7) |
24 (−4) |
26 (−3) |
34 (1) |
39 (4) |
44 (7) |
39 (4) |
39 (4) |
30 (−1) |
24 (−4) |
16 (−9) |
15 (−9) |
| Average precipitation inches (mm) | 4.45 (113) |
4.31 (109) |
3.71 (94) |
1.65 (42) |
.56 (14) |
.20 (5.1) |
.01 (0.25) |
.03 (0.76) |
.37 (9.4) |
1.19 (30) |
2.47 (63) |
4.07 (103) |
23.02 (583.51) |
Population and People
| Historical population | |||
|---|---|---|---|
| Census | Pop. | %± | |
| 1890 | 609 | — | |
| 1950 | 1,690 | — | |
| 1960 | 3,925 | 132.2% | |
| 1970 | 5,810 | 48.0% | |
| 1980 | 11,003 | 89.4% | |
| 1990 | 29,802 | 170.9% | |
| 2000 | 51,884 | 74.1% | |
| 2010 | 72,203 | 39.2% | |
| 2020 | 80,454 | 11.4% | |
| 2023 (est.) | 84,782 | 17.4% | |
| U.S. Decennial Census | |||
Folsom is part of the larger Sacramento metropolitan area. This means it's connected to Sacramento and other nearby cities.
In 2020, Folsom had a population of 80,454 people. The city is home to a diverse mix of people. About 55.90% of residents were White. About 19.57% were Asian, and 4.15% were Black or African American. Around 13.05% of the population was Hispanic or Latino. Many different cultures and backgrounds make up the community in Folsom.
Economy and Jobs
Folsom has a strong economy with many job opportunities.
Major Employers
Here are some of the biggest employers in Folsom:
- Intel Corporation: This technology company is the largest employer in the city.
- California State Prison, Sacramento and Folsom State Prison: These prisons are also major employers.
- Folsom Cordova Unified School District: The local school district employs many people.
- Mercy Hospital of Folsom: A hospital providing healthcare services.
- California ISO: This company manages California's power grid.
- City of Folsom: The city government itself employs many residents.
- SAFE Credit Union: A financial institution.
- Micron Technology, Inc.: Another technology company.
- Costco: A popular retail store.
About 35,500 people in Folsom are part of the workforce. This means they have jobs or are looking for work.
Arts, Culture, and Recreation
Folsom offers many ways to enjoy arts, culture, and outdoor activities.
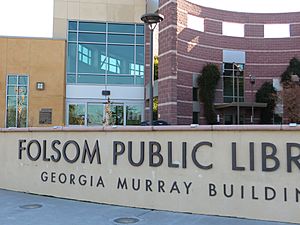
The city has the Folsom Public Library. It is located in the Georgia Murray Building.
Parks and Trails
Livermore Community Park in Folsom has a bike trail, sports fields, and a water park. There are many other bike trails too, like the Humbug-Willow Creek Trail and the Folsom Lake Trail. Folsom is also the end point of the American River Bike Trail, which starts in Sacramento.
Famous Bridges
Folsom has several important bridges. These include the Lake Natoma Crossing and the historic Rainbow Bridge. The Folsom Lake Crossing is another notable bridge. There's also a special pedestrian bridge over East Bidwell Street. It's part of the Johnny Cash Trail. Another bridge, the Johnny Cash Bridge, crosses near Folsom Lake Crossing and East Natoma. It was named in honor of the famous singer.
Education in Folsom
Folsom Lake College is a public community college. It is part of the Los Rios Community College District.
The Folsom Cordova Unified School District runs the public schools in Folsom. The city has two high schools: Folsom High School and Vista del Lago High School. There are also two middle schools: Folsom Middle School and Sutter Middle School.
City Infrastructure
The Sacramento Regional Transit District provides public transportation. In 2005, they extended the light rail train system to Folsom. This Gold Line offers direct service to Downtown Sacramento. The Folsom Stage Line is a public bus service that operates within the city.
In 2020, Folsom and other local customers received permanent federal water contracts. These contracts help ensure a steady water supply from the Central Valley Project.
Notable People from Folsom
Many interesting people have connections to Folsom, including:
- Britani Bateman – an actress and singer.
- Shadrack Biwott – an American long-distance runner.
- Jake Browning – a quarterback for the Cincinnati Bengals football team.
- Peter Camejo – an activist for the Green Party.
- McKenzie Forbes – a WNBA player for the Los Angeles Sparks.
- Spider Jorgensen – a former Major League Baseball player.
- Aspen Ladd – an MMA fighter.
- Brennan Poole – a NASCAR driver.
- Jordan Richards – a free agent safety in football.
- Jonah Williams – an offensive lineman for the Cincinnati Bengals.
Sister Cities
Folsom has special connections with cities in other countries, called "sister cities":
Images for kids
See also
 In Spanish: Folsom (California) para niños
 | Janet Taylor Pickett |
 | Synthia Saint James |
 | Howardena Pindell |
 | Faith Ringgold |


