
Poverty in the United States facts for kids
In the United States, poverty means that many people struggle to meet their basic needs. In 2020, about 37.2 million people were living in poverty. This can happen for many reasons, like differences in how much people earn, rising prices, not enough jobs, or limited education. Even though the U.S. is a rich country, it has more people living in poverty than many other developed countries. This is partly because its support systems for people in need are not as strong.
The U.S. government has tried to help people out of poverty for a long time. This includes programs from the New Deal era during the Great Depression, the national war on poverty in the 1960s, and efforts during the 2008 Great Recession. Two government groups measure poverty. The Census Bureau, part of the Department of Commerce, uses the Official Poverty Measure (OPM). This measure counts cash help from programs like Supplemental Security Income as income. The Department of Health and Human Services sets income levels for who can get government help. Since 2011, the Census Bureau also uses a newer way to measure poverty called the Supplemental Poverty Measure (SPM). The SPM includes non-cash help like Supplemental Nutrition Assistance Program (food stamps) and Medicaid (health care). It also considers how much it costs to live in different parts of the country. The SPM gives a more complete picture of poverty.
In 2021, the SPM showed 7.8% of Americans were in poverty, while the OPM showed 11.6%. For a single person in 2021, the OPM poverty line was $13,800. For a family of four, it was $27,700. The World Bank said that in 2020, only 0.25% of Americans lived in extreme poverty. This means living on less than $2.15 per day. In 2022, the SPM went up to 12.4%. This happened because special payments and tax help from the pandemic ended. About 15.3 million more Americans fell into poverty during this time.
Before the COVID-19 pandemic in 2019, the number of Americans in poverty was at one of its lowest points. This was due to a long period of economic growth. However, between May and October 2020, about eight million people became poor. This was because of the economic effects of the pandemic and the end of CARES Act funds.
Contents
History of Poverty in the U.S.
Early Efforts: 1890s-1920s
People started paying more attention to poverty in the late 1800s. This was partly because of Henry George's 1873 book Progress and Poverty. It made people wonder why poverty existed even when the economy was growing. Social reformers like Florence Kelley and her team at Hull House studied living conditions in Chicago slums in 1895. They made maps showing where people lived and how much money they made.
Another reformer, Jacob Riis, showed the harsh living conditions in New York City's crowded apartment buildings. He did this in his 1890 book How the Other Half Lives.
The Great Depression and New Deal
During the Great Depression, many people lost their jobs and homes. There was no unemployment insurance back then. People who lost everything often lived in shantytowns or "Hoovervilles."
The New Deal programs were created to help. They aimed to create jobs and reduce poverty. The Federal Emergency Relief Administration focused on making jobs. Jobs were more expensive than just giving out cash. But they helped people feel better about themselves. Other New Deal programs like the Civilian Conservation Corps and Public Works Administration also created jobs. The creation of Social Security was also a big step in reducing poverty.
The War on Poverty
In the 1960s, the U.S. started a national "War on Poverty." This was partly inspired by Michael Harrington's 1962 book The Other America. This book made more people aware of how widespread poverty was. The War on Poverty focused on improving education and health care. Many programs were run by the new Office of Economic Opportunity. The government also started using a more official way to measure poverty in 1969.
Poverty in the 21st Century
.jpg)
_0504fIMG_3526_(51354888176).jpg)
The Great Recession in the 2000s caused poverty levels to rise again. By 2009, the number of people in poverty was almost as high as it was in the 1960s. This was the time that led to the War on Poverty. In 2010, census data showed that half of the U.S. population was poor or low-income. One in five young adults (millennials) lived in poverty.
Many international groups have pointed out the poverty issues in the U.S. A 2013 UNICEF report said the U.S. had the second-highest child poverty rate among developed countries. In 2016, the IMF told the U.S. to address its high poverty rate. They suggested raising the minimum wage and offering paid time off for new parents. In 2017, a United Nations expert, Philip Alston, visited the U.S. to study poverty. He said that Alabama had some of the "worst poverty in the developed world." His 2018 report highlighted that 40 million Americans live in poverty. Over five million live in "Third World" conditions.
In 2019, before the pandemic, the percentage of Americans in poverty was 11.1%. This was one of the lowest rates ever recorded. But between May and October 2020, the economic effects of the COVID-19 pandemic pushed about eight million more people into poverty. This happened as government aid ended.
Sociologist Matthew Desmond wrote in 2023 that the poverty rate in the U.S. has not really improved in 50 years. It was 12% in 1970 and 11% in 2019.
How Poverty is Measured
The U.S. government uses different ways to measure poverty. The Census Bureau sets poverty thresholds. These are used for statistics, like counting how many people are in poverty each year. The Department of Health and Human Services sets poverty guidelines. These are used to decide who can get federal help programs. Both are updated every year. The Census Bureau also uses the Supplemental Poverty Measure (SPM) to give a more complete picture.
Poverty Income Thresholds
The idea for poverty income thresholds came from Mollie Orshansky. She was an American economist working for the Social Security Administration. In 1963, she introduced these thresholds.

Orshansky based her thresholds on a "economy food plan" from the USDA. In the 1950s, families of three or more spent about one-third of their income on food. So, poverty thresholds were set at three times the cost of this food plan. Different rules were used for smaller households.
Her work became important when President Johnson started the War on Poverty. Her thresholds gave a way to measure progress. In 1969, it was decided that poverty thresholds would be adjusted each year based on the Consumer Price Index. This means they would change with inflation.
The poverty thresholds have not changed much in the last 50 years. This is despite criticism that they might not be accurate. For example, families now spend less than one-third of their budget on food. If the thresholds were updated based on current spending, they would be much higher.
Poverty Income Guidelines
| Persons in Family Unit |
48 Contiguous States and D.C. |
Alaska | Hawaii |
|---|---|---|---|
| 1 | $14,580 | $18,210 | $16,770 |
| 2 | $19,720 | $24,640 | $22,680 |
| 3 | $24,860 | $31,070 | $28,590 |
| 4 | $30,000 | $37,500 | $34,500 |
| 5 | $35,140 | $43,930 | $40,410 |
| 6 | $40,280 | $50,360 | $46,320 |
| 7 | $45,420 | $56,790 | $52,230 |
| 8 | $50,560 | $63,220 | $58,140 |
| Each additional person adds |
$5,140 | $6,430 | $5,910 |
Poverty guidelines are a simpler version of the thresholds. Federal agencies use them to decide who qualifies for help programs. They are released earlier than the thresholds, so they provide more up-to-date information.
The Department of Health and Human Services now issues these guidelines. They are sometimes called the "federal poverty level" (FPL). However, the HHS prefers not to use that term because it can be confusing.
Supplemental Poverty Measure (SPM)
In 1990, a group asked for a new way to measure poverty. A report in 1995 said the official poverty measure was flawed. It noted that the thresholds were the same everywhere, even though living costs differ. It also said that with rising living standards, the thresholds should be higher.
This led to the Supplemental Poverty Measure (SPM). The SPM tries to fix some problems with the old guidelines. It includes non-cash benefits like food stamps and public housing as income. It also adjusts for different housing costs in different areas. The SPM thresholds are based on how much a family with two children spends on food, clothing, housing, and utilities.
The Census Bureau started publishing SPM measures every year. However, the SPM is meant to "add to" the existing measures, not "replace" them. The old poverty thresholds are still the "official" measure.
Where Poverty is Found
Poverty in U.S. Territories


The highest poverty rates in the U.S. are in its territories. These include American Samoa, Guam, the Northern Mariana Islands, Puerto Rico, and the U.S. Virgin Islands. For example, American Samoa has a very low income per person. In 2017, American Samoa had the highest poverty rate of any U.S. state or territory, at 65%. In 2018, Puerto Rico had the lowest average household income of any state or territory.
Poverty in U.S. States
In 2018, New Hampshire had the lowest poverty rate among U.S. states, at 7.6%. Other states with low poverty rates included Hawaii, Maryland, and Minnesota. Mississippi had the highest poverty rate in 2018, at 19.7%. It was followed by Louisiana, New Mexico, and West Virginia.
Poverty and Different Groups of People
Poverty and Family Type
For married couples, about 5.8% lived in poverty. This number changed based on race and background:
- 5.4% of white people.
- 10.7% of black people.
- 14.9% of Hispanic people.
For single-parent families, 26.6% lived in poverty. This also varied by group:
- 22.5% of white people.
- 44.0% of black people.
- 33.4% of Hispanic people.
Among individuals living alone, 19.1% were in poverty.
- 18% of white people.
- 28.9% of black people.
- 27% of Hispanic people.
Poverty and Race/Ethnicity

In 2014, the U.S. Census said that 14.8% of the general population lived in poverty. About half of those in poverty were non-Hispanic white people.
In 2019, the poverty rate for Black Americans was 18.8%. This was the lowest rate since 1959. However, Black Americans still make up a larger share of the poor population compared to their share of the total population.
Poverty Among Native Americans
Poverty is very high on Native American reservations. Seven of the 11 poorest counties in the U.S. include Lakota Sioux reservations in South Dakota. For example, the Pine Ridge Indian Reservation has very low life expectancy for its residents. In 2017, Wounded Knee, South Dakota, located on this reservation, had one of the lowest average household incomes in the U.S.
Poverty and Age

In 2010, 15.1% of the U.S. population lived in poverty.
- 22% of people under 18.
- 13.7% of those aged 19-21.
- 9% of people aged 65 or older.
The Organisation for Economic Co-operation and Development (OECD) reported in 2008 that child poverty in the U.S. was 20%. Poverty among the elderly was 23%.
Child Poverty

In 2012, 16.1 million American children lived in poverty. Many children live in homes where they don't always have enough food. In 2013, child poverty reached record levels, with 16.7 million children living in homes without enough food. Many of these children live in neighborhoods that lack fresh, healthy food.
Households led by single mothers are often most affected. Some mothers struggle to afford basic items like diapers. Not having enough diapers can make it hard for children to go to daycare. This then makes it harder for single mothers to find or keep jobs.
A 2014 report said that 2.5 million children, or one in every 30, experienced homelessness in 2013. High poverty, lack of affordable housing, and domestic violence were the main reasons.
Racial inequality also plays a role in child poverty. In 2021, the Children's Defense Fund estimated that 71% of children living in poverty were children of color.
Children in poverty may also face health and development problems. They might have weaker immune systems due to poor nutrition. They are also more likely to have long-term illnesses like asthma.
Child poverty more than doubled from 5.2% in 2021 to 12.4% in 2022. This was mainly because pandemic aid, like the expanded child tax credit, ended.
Poverty and Disability
Disabled people in the United States are twice as likely to live in poverty. This is due to ongoing discrimination and barriers to financial security. In 2019, 21.6% of disabled people were considered poor. Disabled workers earn less than their non-disabled peers. In 2020, disabled workers earned 74 cents for every dollar earned by non-disabled workers.
People with disabilities also face extra costs for living. They often lack affordable and accessible transportation and housing. They also may not have access to affordable support services. These factors increase their risk of poverty. Many disabled people struggle to afford rent. They are also more likely to not have enough to eat or to be unable to pay monthly bills.
How Poverty Affects Education
.jpg)
Poverty affects how much access people have to good education. The U.S. education system often gets money from local communities. So, the quality of schools can depend on how wealthy a community is. This can create a cycle of poverty. Poorer communities often cannot afford the same quality of education as richer ones.
What Causes Poverty

Many things contribute to poverty in the United States.
- Education and Income: People with less education often earn less money. In 2007, households led by someone with less than a 9th-grade education earned about $20,805. Those with a bachelor's degree earned about $77,605.
- Job Loss: Losing a job is a major cause of poverty. In 2007, 21.5% of unemployed people were in poverty. Only 2.5% of full-time employed people were.
- Family Structure: Children growing up in families with only a mother and no spouse are four times more likely to be in poverty than children in married-couple families.
- Age and Income: Income levels change with age. Younger households often earn less. For example, in 2009, households led by someone aged 15-24 earned about $30,750. Those led by someone aged 35-44 earned about $61,083.


- Income Differences by Race: Income levels vary among different racial and ethnic groups. In 2021, 21% of all children in the U.S. lived in poverty. About 46% of Black children and 40% of Latino children lived in poverty.
- Income Inequality: Policies that share money from richer families to poorer families can greatly affect poverty. If income differences had not grown so much, poverty could have decreased more.
- Economic System: Some experts say that the U.S. economy creates many jobs that do not pay enough to support families. They also say that the nature of capitalism means there will always be some unemployment. These factors, along with a lack of strong government support, mean there are not enough opportunities for everyone.
- Housing Costs: Landlords in poorer neighborhoods sometimes charge higher rents. This can make it harder for people to afford housing. It can lead to financial struggles, evictions, and homelessness.
Fighting Poverty
_0504IMG_3575_(51355112013).jpg)
_03IMG_0654_(51355915550).jpg)
Many groups, both government and non-government, work to reduce poverty. These efforts range from local neighborhood projects to national campaigns. They help specific groups like children, people with disabilities, or homeless individuals. They use different methods like teaching, social work, making laws, or direct help.
Recent discussions focus on helping families build "assets" (savings and property) not just income. Traditional government programs often focus on giving money or food help. But many families do not have savings to cover basic costs if they lose their income. Programs like Individual Development Accounts (IDAs) help families save money. These savings are often matched by other funds. This helps families buy a first home, get more education, or start a small business.
The Earned Income Tax Credit (EITC) is another important program. It gives money back to people who earn low to moderate incomes. It is seen as the largest program to reduce poverty in the United States. There is a debate about whether tax credits or minimum wage laws are the best way to fight poverty.
Government safety-net programs have helped reduce the poverty rate. Without these programs, the poverty rate would be much higher. However, the U.S. has a weaker social safety net compared to other developed countries.
Images for kids
-
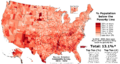
Proportion of Americans living below the poverty line in each county of the fifty states, the District of Columbia, and Puerto Rico according to the 2016–2020 American Community Survey
-
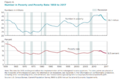
Number in Poverty and Poverty Rate: 1959 to 2017. The US.


See also
- Causes of poverty in the United States
- Eviction in the United States
- Income in the United States
- Income inequality in the United States
- Homelessness in the United States
- Hunger in the United States
- Social programs in the United States
Other topics
- Basic Income
- Negative Income Tax
- The Other America
- Kids Against Hunger
International topics
- Poverty by country
