Race and ethnicity in the United States facts for kids
The United States is home to people from many different backgrounds, races, and cultures. This is called being multicultural. The U.S. government, through the census, keeps track of the population's race and ethnicity. These are counted as two separate things.
The census recognizes five main racial groups: White, Black or African American, American Indian/Alaska Native, Asian, and Native Hawaiian/Other Pacific Islander. People can also choose "two or more races" if their background includes more than one group.
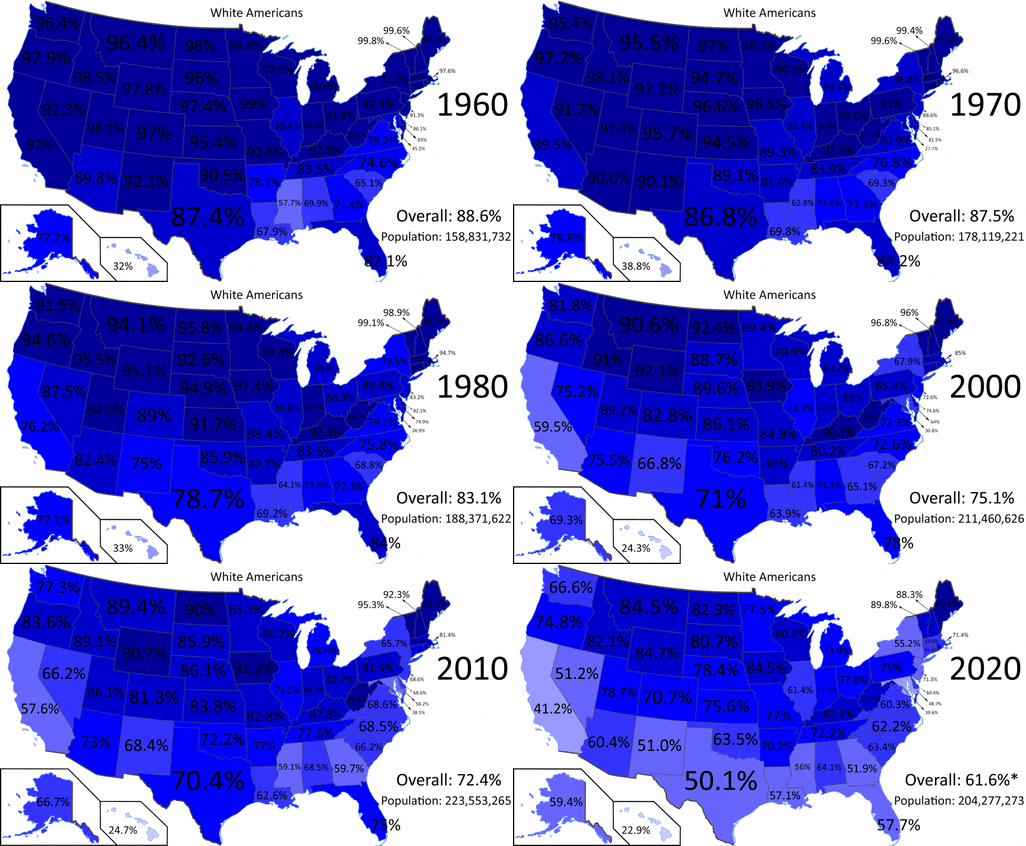
White Americans are the largest racial group in most parts of the country. This includes the Northeast, Midwest, South, and West. However, in states like Hawaii, California, and New Mexico, other groups make up a larger share of the population.
About 55% of all African Americans live in the South. The West is home to the largest share of several other groups. This includes 42% of Hispanic and Latino Americans, 46% of Asian Americans, and 48% of American Indians and Alaska Natives.
The five inhabited U.S. territories each have a main ethnic group. For example, Puerto Rico is mostly Hispanic, and the U.S. Virgin Islands are mostly African American.
Contents
How the U.S. Counts Race and Ethnicity
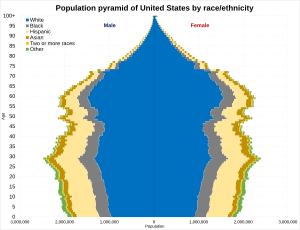
Racial groups in the United States (2020 census) Whites: European and Middle Eastern (61.63%) Black Africans (12.40%) Multiracial (10.21%) East, Central and Southeast Asians (4.26%) South Asians (1.74%) Indigenous (1.12%) Pacific Islanders (0.21%) Some other race (8.42%)
What Are the Main Racial Groups?
The first U.S. census in 1790 had simple categories: free white people, all other free people, and enslaved people. Today, the categories are much more detailed. Since the 2000 census, Americans can choose from these racial groups:
- White: People with origins in Europe, the Middle East, or North Africa.
- Black or African American: People with origins in any of the native peoples of sub-Saharan Africa.
- American Indian or Alaska Native: People with origins in the original peoples of North, Central, and South America.
- Asian: People with origins in the Far East, Southeast Asia, or the Indian subcontinent.
- Native Hawaiian or Other Pacific Islander: People with origins in Polynesia, Melanesia, or Micronesia.
- Two or more races: People who choose more than one race. This group is also known as multiracial.
These categories are ideas created by society and government. They are not based on science. The categories have changed over time. In March 2024, the government updated its rules. It added a "Middle Eastern or North African (MENA)" category and now asks about race and ethnicity in a single question.
Here are the newest definitions from April 2024:
| Race/Ethnicity Reporting Category | Definition |
|---|---|
| American Indian or Alaska Native | People with origins in the original peoples of North, Central, and South America. Examples include Navajo Nation, Aztec, and Maya. |
| Asian | People with origins in Central or East Asia, Southeast Asia, or South Asia. Examples include Chinese, Filipino, Korean, and Japanese. |
| Black or African American | People with origins in any of the Black racial groups of Africa. Examples include African American, Jamaican, Haitian, and Nigerian. |
| Hispanic or Latino | People of Mexican, Puerto Rican, Salvadoran, Cuban, Dominican, Guatemalan, and other Spanish or Latin American cultures. |
| Middle Eastern or North African | People with origins in the Middle East or North Africa. Examples include Lebanese, Iranian, Egyptian, and Israeli. |
| Native Hawaiian or Pacific Islander | People with origins in Hawaii, Guam, Samoa, or other Pacific Islands. Examples include Native Hawaiian, Samoan, and Tongan. |
| White or European American | People with origins in the original peoples of Europe. Examples include English, German, Irish, and Italian. |
Understanding Hispanic and Latino Identity
| 2021 estimates, including separate category for Latino / Hispanic | ||||
|---|---|---|---|---|
| Self-identified race and ethnicity | Percent of population | |||
| White | 59.3% | |||
| Hispanic and Latino | 18.9% | |||
| Black | 12.6% | |||
| Asian | 5.9% | |||
| Two or more races | 2.3% | |||
| American Indian or Alaska Native | 0.7% | |||
| Some other race | 0.5% | |||
| Native Hawaiian or Other Pacific Islander | 0.2% | |||
| 2020 US census, spreading Latino / Hispanic based on their racial identification | ||||
|---|---|---|---|---|
| Self-identified race | Percent of population | |||
| White | 61.6% | |||
| Hispanic and Latino | 18.9% | |||
| Black or African American | 12.4% | |||
| Two or more races | 10.2% | |||
| Some other race | 8.4% | |||
| Asian | 6.0% | |||
| Native American or Alaska Native | 2.9% | |||
| Native Hawaiian or Other Pacific Islander | 0.2% | |||
On the census, the question about being Hispanic or Latino is separate from the race question. This is because Hispanic and Latino Americans can be of any race. Their background is tied to Spanish-speaking countries or Brazil.
Because Latin American countries are racially diverse, "Hispanic or Latino" is not a racial category. When people from these backgrounds fill out the census, they choose from the same racial groups as everyone else. For example, there are White Hispanics, Black Hispanics, and Asian Hispanics.
How Ideas About Race Have Changed
In the early United States, people of Native American, African, and European backgrounds were seen as different races. For a long time, a person's race was decided by their looks, their family history, and how they lived.
Many historians believe these racial rules were created to keep power and wealth in the hands of white people. For example, the "one-drop rule" meant that any person with even one Black ancestor was considered Black. This rule helped preserve a labor force in the South.
Another set of rules, called blood quantum laws, defined who was Native American based on the amount of "Indian blood" they had. These laws often made it easier for white settlers to take over Native American lands.
These rules created a social order where children of mixed-race parents were often assigned to the group with a lower social status. For example, under the laws of slavery, a child born to an enslaved mother was also a slave, no matter who the father was. This was different from English law, where a child's status came from the father.
Over time, these ideas about race have continued to change. The term "Hispanic" became common in the 20th century as more people moved to the U.S. from Spanish-speaking countries. Today, it describes a cultural and language group, not a race.
Major Groups in the U.S. Population
White and European Americans
White Americans are the largest racial group in the U.S. The Census Bureau defines them as people with origins in Europe, the Middle East, or North Africa. This group includes both non-Hispanic Whites and White Hispanics.
In 2020, the largest ancestry groups reported by White Americans were German, English, and Irish. Many people whose families have been in the U.S. for a long time simply identify their ancestry as "American."
Hispanic and Latino Americans
In 2018, there were 59.8 million Hispanic or Latino Americans, making up 18.3% of the U.S. population. This group is diverse and includes people of any race. Their origins are usually in the Spanish-speaking countries of Latin America.
The largest group of Hispanic Americans is Mexican, followed by Puerto Ricans, Cubans, and Salvadorans. The Hispanic population is young and growing fast, mostly due to immigration and higher birth rates.
Black and African Americans
Black and African Americans are the second-largest racial group in the United States. In 2010, there were 42 million Black Americans, including those of mixed race. This was about 13% of the total population.
Most African Americans are descendants of people who were captured in West Africa and enslaved in the U.S. The first Africans arrived in 1619. Slavery was legal in all colonies but was most common in the South. It was ended in 1865 after the American Civil War.
Today, many Black Americans also include recent immigrants from countries in Africa and the Caribbean, such as Jamaica, Haiti, and Nigeria.
Asian Americans
In 2019, the Asian American population was 19.36 million, or 5.9% of the U.S. population. The largest groups are Chinese Americans, Filipino Americans, Indian Americans, Vietnamese Americans, Korean Americans, and Japanese Americans.
Asian immigration began in large numbers in the 19th century, mostly with laborers coming to the West Coast. After immigration laws changed in the mid-20th century, many more people began arriving from all over Asia. Today, Asian Americans live all across the country.
Native Americans and Alaska Natives
Indigenous people, including Native Americans and Alaska Natives, made up 1.1% of the population in 2020, with 3.7 million people. Millions more Americans have some Native American ancestry.
Each Native American tribe sets its own rules for membership. In the past, the Native American population declined sharply. Today, many tribes are working to preserve their cultures and languages. The largest tribes include the Cherokee Nation, the Navajo Nation, and the Lakota (Sioux) Nation.
Native Hawaiians and Other Pacific Islanders
Native Hawaiians and other Pacific Islanders are the smallest minority group in the U.S. In 2019, they numbered about 656,400 people. This group includes people with origins in Hawaii, Samoa, Guam, and other Pacific Islands.
Many people in Hawaii are working to preserve Native Hawaiian culture and language. They have opened special schools and cultural centers.
People of Two or More Races
In 2008, about 7 million Americans, or 2.3% of the population, identified as being of two or more races. The number of people who identify as multiracial is growing.
The largest multiracial group is people who are part White and part another race. For example, many people identify as both White and American Indian, or White and Black. The U.S. has a long history of people from different backgrounds mixing, and today, more people are choosing to embrace their multiracial identity.
See also
 In Spanish: Etnografía de los Estados Unidos para niños
 | Sharif Bey |
 | Hale Woodruff |
 | Richmond Barthé |
 | Purvis Young |


