2009–10 NHL season facts for kids
Quick facts for kids 2009–10 NHL season |
|
|---|---|
| League | National Hockey League |
| Sport | Ice hockey |
| Duration | October 1, 2009 – April 11, 2010 |
| Number of games | 82 |
| Number of teams | 30 |
| Regular season | |
| Presidents' Trophy | Washington Capitals |
| Season MVP | Henrik Sedin (Vancouver) |
| Top scorer | Henrik Sedin (Vancouver) |
| Playoffs | |
| Eastern champions | Philadelphia Flyers |
| Eastern runners-up | Montreal Canadiens |
| Western champions | Chicago Blackhawks |
| Western runners-up | San Jose Sharks |
| Playoffs MVP | Jonathan Toews |
| Stanley Cup | |
| Stanley Cup champions | Chicago Blackhawks |
| Runners-up | Philadelphia Flyers |
| NHL seasons | |
|
← 2008–09 |
2010–11 → |
The 2009–10 NHL season was an exciting year for ice hockey fans! It was the 92nd season for the National Hockey League (NHL). The season started on October 1, 2009, with some games even played in Europe. It ended on April 11, 2010.
A big break happened in the middle of the season, from February 15 to 28. This was so that NHL players could go and play in the 2010 Winter Olympics in Vancouver. Because of the Olympics, there was no special NHL All-Star Game that year.
Regular Season
The regular season is where all the teams play many games to see who is the best. Teams earn points for winning games. The better a team does, the more points they get.
How Teams Are Ranked
At the end of the regular season, teams are ranked by how many points they have. The team with the most points is number one. If two or more teams have the same number of points, here's how the NHL decides who ranks higher:
- The team that played fewer games to get those points. This means they scored more points per game.
- The team that won more games.
- The team that earned more points when they played against each other.
- If two teams are tied and didn't play the same number of home games against each other, some points from their first home game might not count.
- If more than two teams are tied, the team with the most points per game in games played only among those tied teams gets ranked higher.
- The team with a bigger difference between the goals they scored and the goals scored against them. This shows which team won their games by the biggest margins.
Top Players of the Season
These players were the best at scoring points during the regular season. Points are given for goals and assists.
GP = Games played; G = Goals; A = Assists; Pts = Points; +/– = Plus/minus (how many more goals your team scored than the other team while you were on the ice); PIM = Penalty minutes
| Player | Team | GP | G | A | Pts | +/– | PIM |
|---|---|---|---|---|---|---|---|
| Henrik Sedin | Vancouver Canucks | 82 | 29 | 83 | 112 | +35 | 48 |
| Sidney Crosby | Pittsburgh Penguins | 81 | 51 | 58 | 109 | +15 | 69 |
| Alexander Ovechkin | Washington Capitals | 72 | 50 | 59 | 109 | +45 | 89 |
| Nicklas Backstrom | Washington Capitals | 82 | 33 | 68 | 101 | +37 | 50 |
| Steven Stamkos | Tampa Bay Lightning | 82 | 51 | 44 | 95 | -2 | 38 |
| Martin St. Louis | Tampa Bay Lightning | 82 | 29 | 65 | 94 | -8 | 12 |
| Brad Richards | Dallas Stars | 80 | 24 | 67 | 91 | -12 | 14 |
| Joe Thornton | San Jose Sharks | 79 | 20 | 69 | 89 | +17 | 54 |
| Patrick Kane | Chicago Blackhawks | 82 | 30 | 58 | 88 | +16 | 20 |
| Marian Gaborik | New York Rangers | 76 | 42 | 44 | 86 | +15 | 37 |
Top Goaltenders
These goalies were the best at stopping pucks and keeping goals out of their net.
GP = Games played; TOI = Time on ice (minutes); W = Wins; L = Losses; OT = Overtime/shootout losses; GA = Goals against; SO = Shutouts (games where they allowed no goals); SV% = Save percentage (how many shots they stopped); GAA = Goals against average (how many goals they let in per game)
| Player | Team | GP | TOI | W | L | OT | GA | SO | SV% | GAA |
|---|---|---|---|---|---|---|---|---|---|---|
| Tuukka Rask | Boston Bruins | 45 | 2,562:11 | 22 | 12 | 5 | 84 | 5 | .931 | 1.97 |
| Ryan Miller | Buffalo Sabres | 69 | 4,047:10 | 41 | 18 | 8 | 150 | 5 | .929 | 2.22 |
| Martin Brodeur | New Jersey Devils | 77 | 4,499:01 | 45 | 25 | 6 | 168 | 9 | .916 | 2.24 |
| Antti Niemi | Chicago Blackhawks | 39 | 2,190:28 | 26 | 7 | 4 | 82 | 7 | .912 | 2.25 |
| Jimmy Howard | Detroit Red Wings | 63 | 3,740:15 | 37 | 15 | 10 | 141 | 3 | .924 | 2.26 |
| Ilya Bryzgalov | Phoenix Coyotes | 69 | 4,084:27 | 42 | 20 | 6 | 156 | 8 | .920 | 2.29 |
| Miikka Kiprusoff | Calgary Flames | 73 | 4,235:19 | 35 | 28 | 10 | 163 | 4 | .920 | 2.31 |
| Henrik Lundqvist | New York Rangers | 73 | 4,203:49 | 35 | 27 | 10 | 167 | 4 | .921 | 2.38 |
| Jaroslav Halak | Montreal Canadiens | 45 | 2,629:56 | 26 | 13 | 5 | 105 | 5 | .924 | 2.40 |
| Evgeni Nabokov | San Jose Sharks | 71 | 4,194:07 | 44 | 16 | 10 | 170 | 3 | .922 | 2.43 |
Playoffs
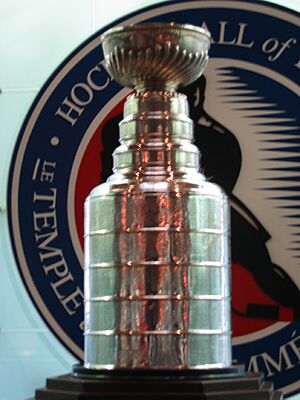
The playoffs are an exciting tournament after the regular season. Only the best teams get to play. The goal is to win the Stanley Cup, which is the biggest prize in hockey!
Playoff Teams
After the regular season, 16 teams made it to the playoffs. The Washington Capitals won the Presidents' Trophy for having the most points in the entire league (121 points). Teams are ranked, or "seeded," based on their regular season performance.
Eastern Conference Teams

- Washington Capitals – They were the best team in the Eastern Conference and won the President's Trophy with 121 points.
- New Jersey Devils – 103 points
- Buffalo Sabres – 100 points
- Pittsburgh Penguins – 101 points
- Ottawa Senators – 94 points
- Boston Bruins – 91 points
- Philadelphia Flyers – 88 points
- Montreal Canadiens – 88 points
Western Conference Teams
- San Jose Sharks – They were the best team in the Western Conference with 113 points.
- Chicago Blackhawks – 112 points
- Vancouver Canucks – 103 points
- Phoenix Coyotes – 107 points
- Detroit Red Wings – 102 points
- Los Angeles Kings – 101 points
- Nashville Predators – 100 points
- Colorado Avalanche – 95 points
Playoff Bracket
This bracket shows how the teams played against each other in the playoffs. The team that won each series moved on to the next round.
| Conference Quarterfinals | Conference Semifinals | Conference Finals | Stanley Cup Final | |||||||||||||||
| 1 | Washington Capitals | 3 | ||||||||||||||||
| 8 | Montreal Canadiens | 4 | ||||||||||||||||
| 4 | Pittsburgh Penguins | 3 | ||||||||||||||||
| 8 | Montreal Canadiens | 4 | ||||||||||||||||
| 2 | New Jersey Devils | 1 | ||||||||||||||||
| 7 | Philadelphia Flyers | 4 | ||||||||||||||||
| 8 | Montreal Canadiens | 1 | ||||||||||||||||
| Eastern Conference | ||||||||||||||||||
| 7 | Philadelphia Flyers | 4 | ||||||||||||||||
| 3 | Buffalo Sabres | 2 | ||||||||||||||||
| 6 | Boston Bruins | 4 | ||||||||||||||||
| 6 | Boston Bruins | 3 | ||||||||||||||||
| 7 | Philadelphia Flyers | 4 | ||||||||||||||||
| 4 | Pittsburgh Penguins | 4 | ||||||||||||||||
| 5 | Ottawa Senators | 2 | ||||||||||||||||
| E7 | Philadelphia Flyers | 2 | ||||||||||||||||
| W2 | Chicago Blackhawks | 4 | ||||||||||||||||
| 1 | San Jose Sharks | 4 | ||||||||||||||||
| 8 | Colorado Avalanche | 2 | ||||||||||||||||
| 1 | San Jose Sharks | 4 | ||||||||||||||||
| 5 | Detroit Red Wings | 1 | ||||||||||||||||
| 2 | Chicago Blackhawks | 4 | ||||||||||||||||
| 7 | Nashville Predators | 2 | ||||||||||||||||
| 1 | San Jose Sharks | 0 | ||||||||||||||||
| Western Conference | ||||||||||||||||||
| 2 | Chicago Blackhawks | 4 | ||||||||||||||||
| 3 | Vancouver Canucks | 4 | ||||||||||||||||
| 6 | Los Angeles Kings | 2 | ||||||||||||||||
| 2 | Chicago Blackhawks | 4 | ||||||||||||||||
| 3 | Vancouver Canucks | 2 | ||||||||||||||||
| 4 | Phoenix Coyotes | 3 | ||||||||||||||||
| 5 | Detroit Red Wings | 4 | ||||||||||||||||
NHL Awards
Many special awards are given out at the end of the season to recognize the best teams and players. Here are some of the awards from the 2009–10 NHL season:
Milestones
This section lists some important "firsts" and "lasts" for players during this season.
First Games
These players played their very first NHL game in the 2009–10 season:
- John Tavares, New York Islanders
- Matt Duchene, Colorado Avalanche
- Tyler Myers, Buffalo Sabres
- Tyler Bozak, Toronto Maple Leafs
Last Games
This player played his last NHL game in the 2009–10 season:
- Keith Tkachuk, St. Louis Blues
 | John T. Biggers |
 | Thomas Blackshear |
 | Mark Bradford |
 | Beverly Buchanan |

