Central Canada facts for kids
Quick facts for kids
Central Canada
Centre du Canada (French)
|
|
|---|---|

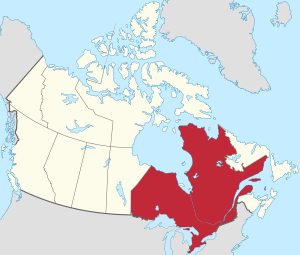
Map of Central Canada, defined politically
|
|
| Composition | |
| Largest city | Toronto |
| Largest metro | Greater Toronto Area |
| Canadian Confederation | 1 July 1867 |
| Area
(2021 - land, 2017 - fresh water)
|
|
| • Total | 2,552,291.51 km2 (985,445.26 sq mi) |
| • Land | 2,191,011.51 km2 (845,954.27 sq mi) |
| • Water | 361,280.00 km2 (139,490.99 sq mi) |
| Population
(2021)
|
|
| • Total | 22,725,775 |
| • Density | 10.4/km2 (27/sq mi) |
| Time zones | |
| Western Ontario | UTC−06:00 (CST) |
| • Summer (DST) | UTC−05:00 (CDT) |
| Eastern Ontario / most of Quebec | UTC−05:00 (EST) |
| • Summer (DST) | UTC−04:00 (EDT) |
| Eastern Quebec | UTC−04:00 (AST) |
| • Summer (DST) | UTC−03:00 (ADT) |
Central Canada (French: Centre du Canada) is a large region in Canada. It includes two of Canada's biggest and most populated provinces: Ontario and Quebec.
Even though it's called "Central Canada," this area is actually more towards the east side of the country. Because so many people live here, Ontario and Quebec have a lot of say in Canadian politics. Before Canada became a country, the name "Canada" actually referred only to this central area. Today, people usually just say "Ontario" or "Quebec" instead of "Central Canada."
Contents
History of Central Canada
Before Canada became a country in 1867, the area we now call Central Canada was simply known as "Canada." The southern part of Ontario was once called Upper Canada. Later, it was renamed Canada West. Similarly, southern Quebec was known as Lower Canada, and then later as Canada East. In 1841, both of these areas became part of the United Province of Canada.
Geography of Central Canada
Central Canada is made up of Ontario and Quebec. These two provinces cover a huge amount of land and water.
Ontario's Size
Ontario is Canada's fourth largest area overall. It has a land area of about 892,411.76 km2 (344,562.11 sq mi). This is about 10% of all the land in Canada. Ontario also has a lot of fresh water, about 177,390 km2 (68,490 sq mi). This makes it the province with the second most fresh water in Canada. When you add land and water, Ontario covers a total of 1,069,801.76 km2 (413,052.77 sq mi).
Quebec's Size
Quebec is Canada's second largest area and its biggest province. It has a land area of about 1,298,599.75 km2 (501,392.17 sq mi). This is nearly 15% of Canada's total land. Quebec also has the most fresh water of any province, with about 183,890 km2 (71,000 sq mi). In total, Quebec covers about 1,482,489.75 km2 (572,392.49 sq mi).
Combined Area
Together, Ontario and Quebec have a land area of over 2,191,011.51 km2 (845,954.27 sq mi). They also hold a massive amount of fresh water, about 361,280.00 km2 (139,490.99 sq mi). This combined area makes up more than a quarter of Canada's total size.
Where is the Centre?
Even though the region is called "Central Canada," the actual geographic centre of Canada is not here. The middle point of Canada from east to west is near Winnipeg, Manitoba. The middle point from north to south is in Nunavut, near Yathkyed Lake.
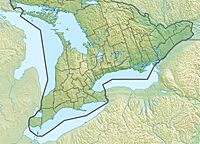
Ontario's Landscape
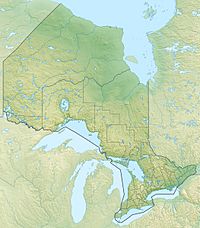
Quebec's Landscape
Population of Central Canada
Ontario and Quebec are home to most Canadians. About 61% of Canada's population lives in these two provinces. In 2021, over 22.7 million people lived here. This was an increase of about 5% from 2016. The average age in Ontario is 41.6 years, which is the same as the rest of Canada. In Quebec, the average age is slightly older at 43.2 years.
Diverse Communities
Central Canada is a very diverse place. Many different groups of people live here.
| Population of visible minority, Indigenous, and others (2021 Canadian census) | ||||||||||
|---|---|---|---|---|---|---|---|---|---|---|
| Ontario | Quebec | Central Canada | Canada | |||||||
| Population group | Population |
% of province |
Population |
% of province |
Population |
% of Central Canada |
% of Canada |
Population |
% |
|
| Non-visible minority or Indigenous | 8,807,805 | 62.8% | 6,762,735 | 81.4% | 15,570,541 | 61.4% | 42.9% | 25,364,140 | 69.8% | |
| Visible minority group | South Asian | 1,515,295 | 10.8% | 127,990 | 1.5% | 1,643,285 | 7.4% | 4.5% | 2,571,400 | 7.1% |
| Chinese | 820,245 | 5.8% | 115,240 | 1.4% | 935,485 | 4.2% | 2.6% | 1,715,770 | 4.7% | |
| Black | 768,740 | 5.5% | 422,405 | 5.1% | 1,191,145 | 5.3% | 3.3% | 1,574,870 | 4.3% | |
| Filipino | 363,650 | 2.6% | 44,885 | 0.5% | 408,535 | 1.8% | 1.1% | 957,355 | 2.6% | |
| Arab | 284,215 | 2.0% | 280,075 | 3.4% | 564,290 | 2.5% | 1.6% | 694,015 | 1.9% | |
| Latin American | 249,190 | 1.8% | 172,925 | 2.1% | 422,115 | 1.9% | 1.2% | 580,235 | 1.6% | |
| Southeast Asian | 167,845 | 1.2% | 70,455 | 0.8% | 238,300 | 1.1% | 0.7% | 390,340 | 1.1% | |
| West Asian | 212,185 | 1.5% | 43,985 | 0.5% | 256,170 | 1.1% | 0.7% | 360,495 | 1.0% | |
| Korean | 99,425 | 0.7% | 10,360 | 0.1% | 109,785 | 0.5% | 0.3% | 218,140 | 0.6% | |
| Japanese | 31,420 | 0.2% | 5,305 | 0.1% | 36,725 | 0.2% | 0.1% | 98,890 | 0.3% | |
| Visible minority, n.i.e. | 124,120 | 0.9% | 12,150 | 0.1% | 136,270 | 0.6% | 0.4% | 331,805 | 0.9% | |
| Multiple visible minority | 181,025 | 1.3% | 34,960 | 0.4% | 215,985 | 1.0% | 0.6% | 172,885 | 0.5% | |
| Total visible minority population | 4,817,360 | 34.3% | 1,340,735 | 16.1% | 6,158,095 | 27.6% | 17.0% | 9,639,205 | 26.5% | |
| Indigenous peoples First Nations (North American Indian) | 251,030 | 1.8% | 116,550 | 1.4% | 367,580 | 1.6% | 1.0% | 1,048,405 | 2.9% | |
| Métis | 134,615 | 1.0% | 61,010 | 0.7% | 195,625 | 0.9% | 0.5% | 624,220 | 1.7% | |
| Inuk (Inuit) | 4,310 | 0.0% | 15,800 | 0.2% | 20,110 | 0.1% | 0.1% | 70,540 | 0.2% | |
| Multiple Indigenous responses | 7,115 | 0.1% | 3,135 | 0.1% | 10,250 | 0.0% | 0.0% | 28,855 | 0.1% | |
| Indigenous responses n.i.e. | 9,515 | 0.1% | 8,515 | 0.0% | 18,030 | 0.1% | 0.0% | 35,225 | 0.1% | |
| Total Indigenous population | 406,585 | 2.9% | 205,010 | 2.5% | 611,595 | 2.7% | 1.7% | 1,807,250 | 5.0% | |
| Total population | 14,031,750 | 100.00% | 8,308,480 | 100.00% | 22,340,230 | 100.00% | 61.5% | 36328480 | 100.00% | |
Major Cities and Urban Areas
The southern parts of Ontario and Quebec are very urbanized. This area is known as the Quebec City–Windsor Corridor. It is where most of the people live and where many industries are located. This corridor includes Canada's two largest cities: Toronto and Montreal. It also includes the capital city of Canada, Ottawa, and the surrounding National Capital Region.
In 2021, Statistics Canada listed 24 large urban areas, called Census Metropolitan Areas (CMAs), in Central Canada. Most of these are in Southern Ontario and Southern Quebec. Only a few, like Greater Sudbury and Thunder Bay, are in Northern Ontario.
Here are some of the largest CMAs in Central Canada by population:
| Name | Province | Population | Land area | Density | Location | References |
|---|---|---|---|---|---|---|
| Toronto | Ontario | 6,202,225 | 5,902.75 km2 (2,279.06 sq mi) |
1,050.7/km2 (2,721.3/sq mi) |
||
| Montreal | Quebec | 4,291,732 | 4,670.1 km2 (1,803.1 sq mi) |
919.0/km2 (2,380.2/sq mi) |
||
| Ottawa - Gatineau | Ontario | 1,488,307 | 8,046.99 km2 (3,106.96 sq mi) |
185.0/km2 (479.1/sq mi) |
||
| Ottawa - Gatineau (Ontario part) | Ontario | 1,135,014 | 4,665.16 km2 (1,801.23 sq mi) |
243.3/km2 (630.1/sq mi) |
||
| Quebec City | Quebec | 839,311 | 3,499.46 km2 (1,351.15 sq mi) |
239.8/km2 (621.1/sq mi) |
||
| Hamilton | Ontario | 785,184 | 1,373.15 km2 (530.18 sq mi) |
571.8/km2 (1,481.0/sq mi) |
||
| Kitchener - Cambridge – Waterloo | Ontario | 575,847 | 1,092.33 km2 (421.75 sq mi) |
527.2/km2 (1,365.4/sq mi) |
||
| London | Ontario | 543,551 | 2,661.48 km2 (1,027.60 sq mi) |
204.2/km2 (528.9/sq mi) |
||
| St. Catharines - Niagara | Ontario | 433,604 | 1,397.09 km2 (539.42 sq mi) |
310.4/km2 (803.9/sq mi) |
||
| Windsor | Ontario | 422,630 | 1,803.17 km2 (696.21 sq mi) |
234.4/km2 (607.1/sq mi) |
||
| Oshawa | Ontario | 415,311 | 903.25 km2 (348.75 sq mi) |
459.8/km2 (1,190.9/sq mi) |
||
| Ottawa – Gatineau (Quebec part) | Quebec | 353,293 | 3,381.83 km2 (1,305.73 sq mi) |
104.5/km2 (270.7/sq mi) |
||
| Sherbrooke | Quebec | 227,398 | 1,458.1 km2 (563.0 sq mi) |
156.0/km2 (404.0/sq mi) |
||
| Barrie | Ontario | 212,856 | 897.26 km2 (346.43 sq mi) |
237.2/km2 (614.3/sq mi) |
||
| Kingston | Ontario | 172,546 | 1,919.17 km2 (741.00 sq mi) |
89.9/km2 (232.8/sq mi) |
||
| Greater Sudbury / Grand Sudbury | Ontario | 170,605 | 4,187.4 km2 (1,616.8 sq mi) |
40.7/km2 (105.4/sq mi) |
||
| Guelph | Ontario | 165,588 | 595.08 km2 (229.76 sq mi) |
278.3/km2 (720.8/sq mi) |
||
| Saguenay | Quebec | 161,567 | 3,133.53 km2 (1,209.86 sq mi) |
51.6/km2 (133.6/sq mi) |
||
| Trois-Rivières | Quebec | 161,489 | 1,038.64 km2 (401.02 sq mi) |
155.5/km2 (402.7/sq mi) |
||
| Brantford | Ontario | 144,162 | 1,074.0 km2 (414.7 sq mi) |
134.2/km2 (347.6/sq mi) |
||
| Peterborough | Ontario | 128,624 | 1,508.44 km2 (582.41 sq mi) |
85.3/km2 (220.9/sq mi) |
||
| Thunder Bay | Ontario | 123,258 | 2,550.79 km2 (984.87 sq mi) |
48.3/km2 (125.1/sq mi) |
||
| Belleville - Quinte West | Ontario | 111,184 | 1,337.5 km2 (516.4 sq mi) |
83.1/km2 (215.2/sq mi) |
||
| Drummondville | Quebec | 101,610 | 1,094.36 km2 (422.53 sq mi) |
92.8/km2 (240.4/sq mi) |
 | Stephanie Wilson |
 | Charles Bolden |
 | Ronald McNair |
 | Frederick D. Gregory |


