EFL League Two facts for kids
 |
|
| Founded | 2004
|
|---|---|
| Country | England |
| Other club(s) from | Wales |
| Number of teams | 24 |
| Level on pyramid | 4 |
| Promotion to | EFL League One |
| Relegation to | National League |
| Domestic cup(s) | FA Cup |
| League cup(s) |
|
| International cup(s) |
|
| Current champions | Doncaster Rovers 1st League Two title 4th fourth tier title (2024–25) |
| Most championships | Chesterfield (2 Fourth tier titles and 2 EFL League Two) Doncaster Rovers (2 Fourth tier titles and 2 EFL League Two) |
| TV partners | List of broadcasters |
The English Football League Two, often called League Two, is a professional football league in England. It is the fourth level of English football, coming after the Premier League, EFL Championship, and EFL League One. Twenty-four teams compete in League Two each season.
The league started in the 2004–05 season. It used to be known as the Football League Third Division. As of the 2025–26 season, Newport County has been in this division the longest, joining in the 2012–13 season. Two teams that used to play in the Premier League are currently in League Two: Oldham Athletic and Swindon Town.
The current champions are Doncaster Rovers.
Contents
How League Two Works
There are 24 clubs in League Two. Each club plays every other club twice, once at home and once away. This means each team plays a total of 46 matches in a season.
- Teams get three points for a win.
- They get one point for a draw.
- They get no points for a loss.
These points are used to create a league table.
Moving Up and Down
At the end of each season:
- The top three teams in League Two automatically move up to EFL League One.
- Another team also moves up by winning the play-offs. These play-offs are between the teams that finished in fourth to seventh place.
- The four teams that finished at the bottom of League One replace the promoted teams.
Similarly, at the bottom of League Two:
- The two teams that finish last are moved down to the National League.
- They are replaced by the team that finishes first in the National League and the team that wins the National League play-offs.
How Teams are Ranked
If teams have the same number of points, their final position is decided by:
- First, their goal difference (goals scored minus goals against).
- Then, the total goals they scored.
- After that, the results of games played between those specific teams.
- Finally, if needed, special play-off matches.
There's also a rule that limits how much clubs can spend on players' wages. It's capped at 55% of the club's total income.
Teams Playing Now
- Note: Table lists in alphabetical order.
| Team | Location | Stadium | Capacity |
|---|---|---|---|
| Accrington Stanley | Accrington | Crown Ground | 5,450 |
| Barnet | London (Canons Park) | The Hive Stadium | 6,418 |
| Barrow | Barrow-in-Furness | Holker Street | 6,500 |
| Bristol Rovers | Bristol (Horfield) | Memorial Stadium | 9,832 |
| Bromley | London (Bromley) | Hayes Lane | 5,300 |
| Cambridge United | Cambridge | Abbey Stadium | 8,127 |
| Cheltenham Town | Cheltenham | Whaddon Road | 7,066 |
| Chesterfield | Chesterfield | SMH Group Stadium | 10,504 |
| Colchester United | Colchester | Colchester Community Stadium | 10,105 |
| Crawley Town | Crawley | Broadfield Stadium | 5,996 |
| Crewe Alexandra | Crewe | Gresty Road | 10,153 |
| Fleetwood Town | Fleetwood | Highbury Stadium | 5,327 |
| Gillingham | Gillingham | Priestfield Stadium | 11,582 |
| Grimsby Town | Cleethorpes | Blundell Park | 9,052 |
| Harrogate Town | Harrogate | Wetherby Road | 5,000 |
| Milton Keynes Dons | Milton Keynes (Denbigh) | Stadium MK | 30,500 |
| Newport County | Newport | Rodney Parade | 7,850 |
| Notts County | Nottingham | Meadow Lane | 19,841 |
| Oldham Athletic | Oldham | Boundary Park | 13,513 |
| Salford City | Salford | Moor Lane | 5,108 |
| Shrewsbury Town | Shrewsbury | New Meadow | 9,875 |
| Swindon Town | Swindon | County Ground | 15,728 |
| Tranmere Rovers | Birkenhead (Prenton) | Prenton Park | 16,789 |
| Walsall | Walsall (Bescot) | Bescot Stadium | 11,300 |
Teams Promoted from League Two
This table shows the teams that have been promoted from League Two since it started in 2004.
Play-off Matches
The play-offs are exciting games that decide which team gets the final promotion spot.
Teams Relegated from League Two
This table shows which teams have moved down from League Two to the National League.
| Season | Clubs |
|---|---|
| 2004–05 | Kidderminster Harriers, Cambridge United |
| 2005–06 | Oxford United, Rushden & Diamonds |
| 2006–07 | Boston United, Torquay United |
| 2007–08 | Mansfield Town, Wrexham |
| 2008–09 | Chester City, Luton Town |
| 2009–10 | Darlington, Grimsby Town |
| 2010–11 | Lincoln City, Stockport County |
| 2011–12 | Macclesfield Town, Hereford United |
| 2012–13 | Aldershot Town, Barnet |
| 2013–14 | Bristol Rovers, Torquay United |
| 2014–15 | Cheltenham Town, Tranmere Rovers |
| 2015–16 | York City, Dagenham & Redbridge |
| 2016–17 | Hartlepool United, Leyton Orient |
| 2017–18 | Barnet, Chesterfield |
| 2018–19 | Notts County, Yeovil Town, Bury |
| 2019–20 | Macclesfield Town, Bury |
| 2020–21 | Southend United, Grimsby Town |
| 2021–22 | Oldham Athletic, Scunthorpe United |
| 2022–23 | Hartlepool United, Rochdale |
| 2023–24 | Sutton United, Forest Green Rovers |
| 2024–25 | Carlisle United, Morecambe |
Top Goal Scorers
This table lists the players who scored the most goals each season.
| Season | Top scorer(s) | Club(s) | Goals |
|---|---|---|---|
| 2004–05 | Yeovil Town | 27 | |
| 2005–06 | Carlisle United | 22 | |
| 2006–07 | Hartlepool United | 21 | |
| Milton Keynes Dons | |||
| 2007–08 | Peterborough United | 29 | |
| 2008–09 | Shrewsbury Town | 20 | |
| Chesterfield | |||
| 2009–10 | Notts County | 30 | |
| 2010–11 | Crewe Alexandra | 28 | |
| 2011–12 | Northampton Town | 18 | |
| AFC Wimbledon | |||
| Barnet | |||
| Rotherham United | |||
| 2012–13 | Port Vale | 31 | |
| 2013–14 | Scunthorpe United | 23 | |
| 2014–15 | Portsmouth | 21 | |
| 2015–16 | Bristol Rovers | 27 | |
| 2016–17 | Barnet | 26 | |
| Doncaster Rovers | |||
| 2017–18 | Accrington Stanley | 25 | |
| 2018–19 | Tranmere Rovers | 29 | |
| 2019–20 | Bradford City, Swindon Town | 25 | |
| 2020–21 | Cambridge United | 32 | |
| 2021–22 | Newport County | 25 | |
| 2022–23 | Bradford City | 28 | |
| 2023–24 | Notts County | 28 | |
| 2024–25 | Bromley | 25 |
Fan Attendance
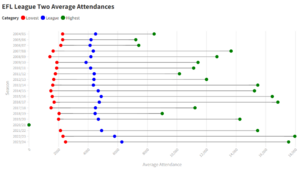
League Two is very popular! It is the most-watched fourth-tier sports league in the world. It is also the 14th most-watched football league in Europe at any level. In the 2023–24 season, over 3.4 million people watched League Two games.
Since 2004, the average number of fans at a League Two game has been about 4,602. The highest average attendance for the whole league was 6,274 in the 2023–24 season. The team with the highest average attendance for a single club was Bradford City in the 2022–23 season, with 17,967 fans per game.
| Season | League average attendance | Highest average | ||
|---|---|---|---|---|
| Club | Attendance | |||
| 2004–05 | 4,499 | Swansea City | 8,458 | |
| 2005–06 | 4,194 | Carlisle United | 7,218 | |
| 2006–07 | 4,130 | Swindon Town | 7,419 | |
| 2007–08 | 4,346 | Bradford City | 13,659 | |
| 2008–09 | 4,185 | Bradford City | 12,704 | |
| 2009–10 | 3,856 | Bradford City | 11,423 | |
| 2010–11 | 4,166 | Bradford City | 11,128 | |
| 2011–12 | 4,407 | Bradford City | 10,170 | |
| 2012–13 | 4,390 | Bradford City | 11,999 | |
| 2013–14 | 4,352 | Portsmouth | 15,460 | |
| 2014–15 | 4,676 | Portsmouth | 15,241 | |
| 2015–16 | 4,881 | Portsmouth | 16,442 | |
| 2016–17 | 4,751 | Portsmouth | 16,822 | |
| 2017–18 | 4,491 | Coventry City | 11,218 | |
| 2018–19 | 4,467 | Lincoln City | 9,005 | |
| 2019–20 | 4,687 | Bradford City | 14,253 | |
| 2020–21 | No fans allowed due to the COVID-19 pandemic | |||
| 2021–22 | 4,907 | Bradford City | 15,450 | |
| 2022–23 | 5,786 | Bradford City | 17,967 | |
| 2023–24 | 6,274 | Bradford City | 17,547 | |
| 2024–25 | 6,221 | Bradford City | 17,762 | |
League History
Since League Two started in 2004, 69 different teams have played in it. This includes 2 of the 20 teams that are in the 2025–26 Premier League.
Morecambe has spent the most seasons in League Two, with 16 seasons in total. They also had the longest continuous time in the division, playing for 13 seasons in a row from 2005 to 2019. Currently, Newport County has been in the league for the longest time, with 13 seasons in a row.
Northampton Town and Bristol Rovers have each been promoted from League Two four times. There have been 18 different champions, but Swindon Town and Chesterfield have won the title twice each.
See also
 In Spanish: English Football League Two para niños
 | Audre Lorde |
 | John Berry Meachum |
 | Ferdinand Lee Barnett |


